Figure 1.
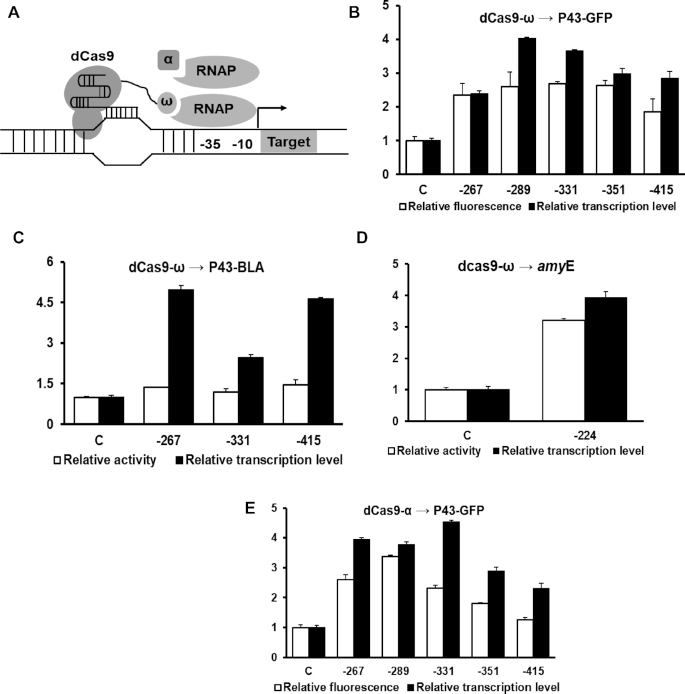
dCas9-α/ω mediated activation of reporter and endogenous genes in Bacillus subtilis. (A) Schematic description of dCas9-α and dCas9-ω mediated gene expression activation. (B) The activation efficiency of dCas9-ω on P43-GFP expression cassette. The relative fluorescence of GFP was measured after guiding the dCas9-ω to different upstream regions of promoter P43. (C) The activation efficiency of dCas9-ω on P43-BLA expression cassette. (D) The activation effect of dCas9-ω on endogenous gene by guiding dCas9-ω to site 224-bp upstream of amyE. (E) The activation efficiency of dCas9-α on P43-GFP expression cassette. The relative transcription level represents the value of 2−ΔΔCq that was measured by qRT-PCR. The x-axis indicates the distances of target sites to transcription start site. - represents upstream region. C represents control where sgRNA without target sequence was used. White and black bars represent the relative fluorescence intensity and relative transcription respectively.

