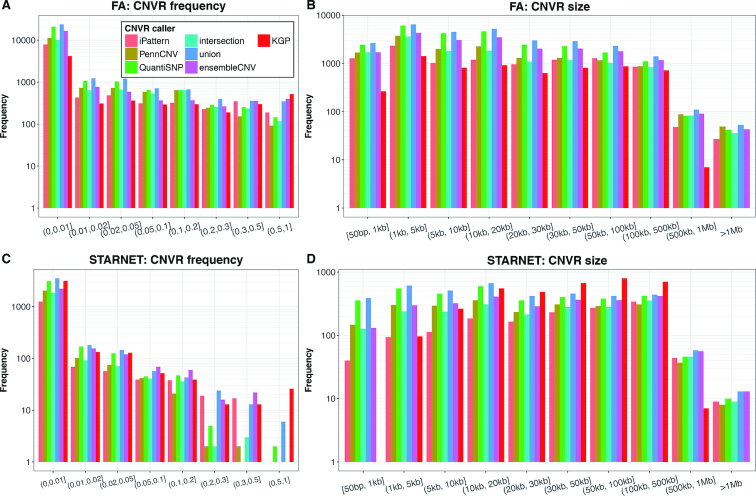
Figure 5.
CNVR frequency and size distribution. The frequency (A and C) and size (B and D) of CNVRs detected in the FA (A and B) and STARNET (C and D) datasets using the six methods as well as those detectable CNVRs (spanning at least 5 probes in each of the dataset). The frequency of a CNVR refers to the proportion of the unrelated carriers of a CNV genotype instead of allele frequency at the CNVR. The frequency in KGP was calculated based on European populations.

