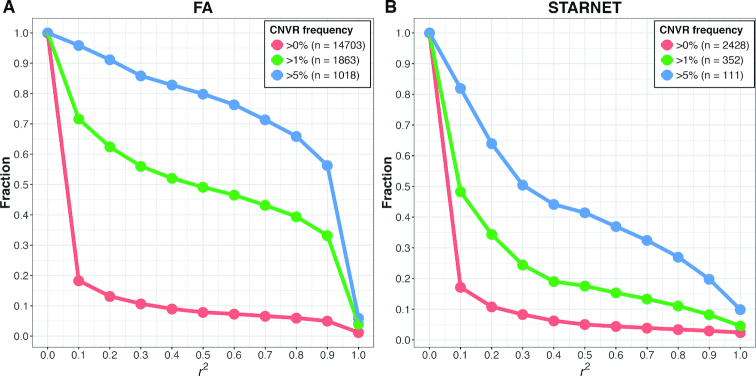
Figure 6.
Linkage disequilibrium (LD) between CNVR and nearby SNP probes. LD (r2) was estimated as the maximum of squared Pearson correlations between the copy number at each CNVR resulted from ensembleCNV and the genotype (coded as 0, 1 and 2 copies of alternative alleles) of SNPs within 500kb upstream and downstream of the CNVR in the FA (A) and STARNET datasets (B). The plots show the fraction of CNVRs as the threshold of LD measure increases. The call set of CNVRs is further categorized by frequency greater than 0%, 1% and 5%, respectively, with the total number of CNVRs in each subset indicated in the legend. The frequency of a CNVR refers to the percentage of the unrelated carriers of a CNV genotype at the CNVR.

