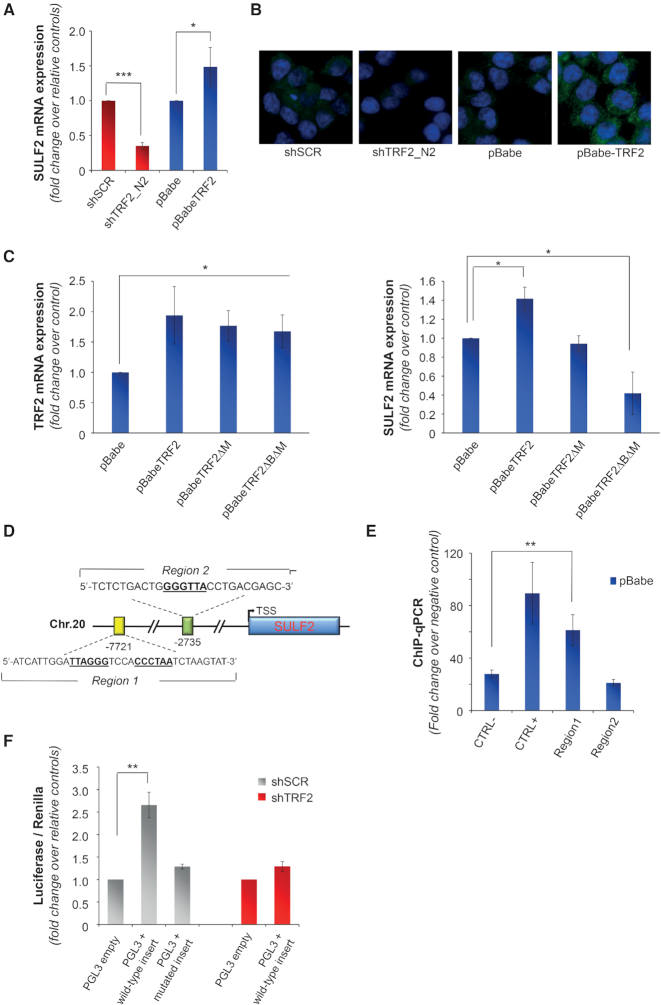
Figure 4.
Extracellular release of VEGF-A is regulated by TRF2 through the control of SULF2 expression. (A) Gene expression of SULF2 was evaluated by qPCR in HCT116 cells silenced (shTRF2) or overexpressing (pBabe-TRF2) TRF2 and in their control counterparts (shScramble and pBabe). Results are expressed as fold change of mRNA levels in silenced/overexpressing cells over their controls, after β-actin normalization. (B) IF analysis of SULF2 expression in cells silenced or overexpressing TRF2 and their controls. Representative images acquired at 63x magnification are shown. (C) Expression of TRF2 (left panel) and SULF2 (right panel) was evaluated by qPCR in HCT116 cells overexpressing the wild-type (pBabe TRF2) or the mutated forms of TRF2 (pBabe TRF2ΔM and pBabe TRF2ΔBΔM) and their control counterpart (pBabe). Results are expressed as fold change of mRNA levels in overexpressing cells over their controls, after β-actin normalization. (D) Schematic representation of putative TRF2-binding sites located upstream the transcription starting site (TSS) of SULF2. (E) Real-time qPCR analysis of TRF2-chromatin immunoprecipitates. DNA regions containing (Chr.2 sub-telomeric region) or not (RPLP0) TTAGGG sequences were used as positive and negative control, respectively. (F) pGL3-promoter vector (pGL3 empty) and the vector containing the wild-type or mutant form of the distal regulatory element were co-transfected with a renilla vector (pRL-TK) in control (pBabe) and TRF2 silenced (shTRF2) HCT116 cells and luciferase activity was assayed. Firefly luciferase signal was normalized for the renilla signal to derive the relative luciferase activity. Results are expressed as fold change over the activity measured in the cells transfected with the control vector. The histograms show the mean ± SE of at least three independent experiments performed in triplicate (*P < 0.1, **P < 0.01, ***P < 0.001; Student's t-test).

