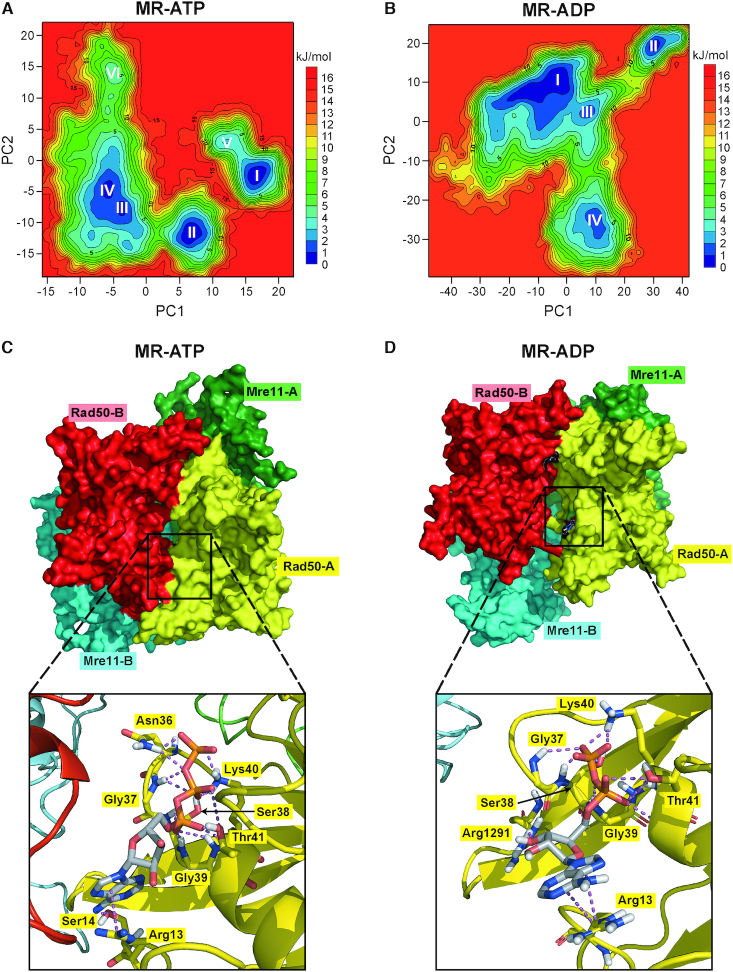
Figure 6.
MD simulations to identify stable MR-ATP and MR-ADP conformations. (A, B) FELs were evaluated for MR-ATP (A) and MR-ADP (B). Analyses have been carried out using the projection of concatenated trajectories along the first and the second principal components (PC1 and PC2) as reaction coordinates. Basins are progressively numbered according to their energetic stability. Energy values are reported in kJ/mol. (C, D) The most energetically favoured conformations shown are derived from the FELs and cluster analysis for MR-ATP (C) (corresponding to basin I in panel A) and MR-ADP (D) (corresponding to basin I in panel B). Rad50 subunits are in red and yellow; Mre11 subunits are in cyan and green. Close-up views of one of the nucleotide binding sites are shown at the bottom. Nucleotides and residues interacting with ATP/ADP are shown as sticks; each residue is colored according to the chain it belongs to.

