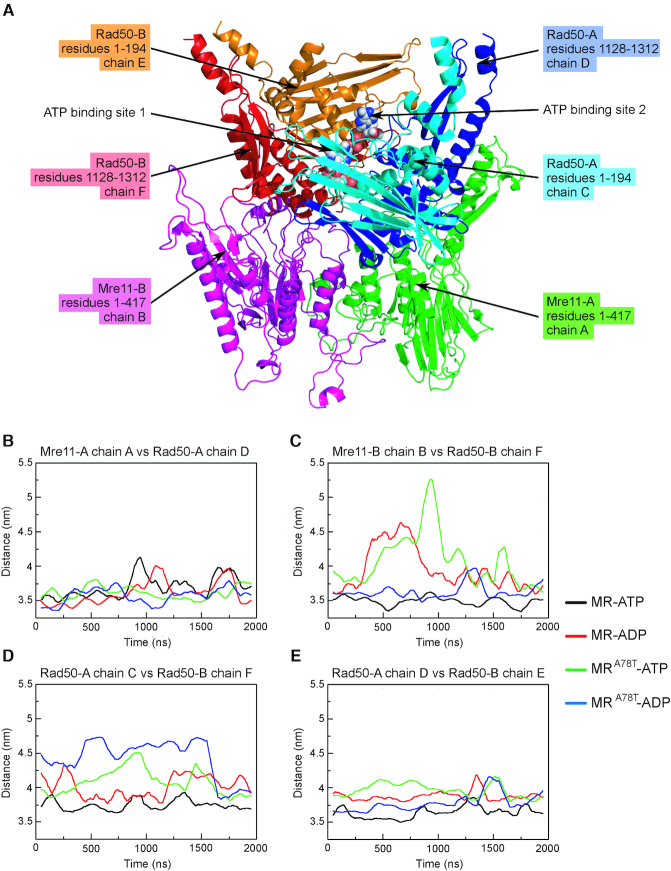
Figure 7.
Distance between the centers of mass (COM) of the MR complex subunits. (A) Labeling of the different chains in the model used for simulations. Mre11 and Rad50 monomers are indicated as A and B. Mre11-A and Mre11-B monomers are in green and purple, respectively; N-terminal and C-terminal parts of Rad50-A monomer are in light blue and dark blue, respectively; N-terminal and C-terminal parts of Rad50-B monomer are in orange and red, respectively. (B–E) Graphs show distances among centres of mass of the indicated chains as monitored along the concatenated trajectory of the MD simulations.

