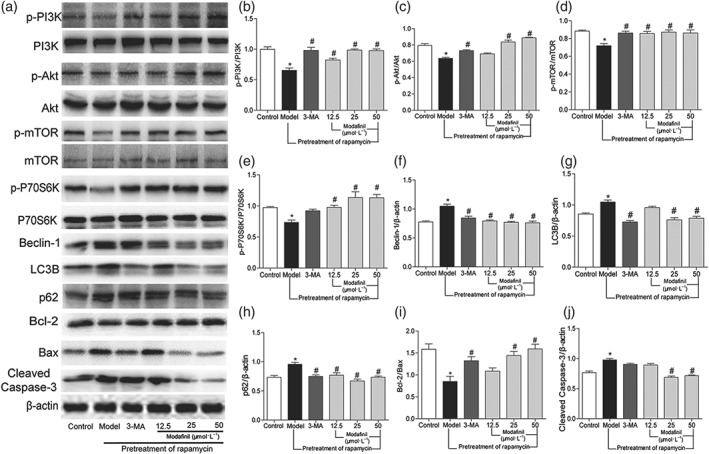
Figure 8.

The effect of modafinil on the proteins related with autophagy and apoptosis in HT‐22 cells induced by rapamycin (Model). (a) Western blotting bands of respective proteins. (b–j) Grey intensity analysis of p‐PI3K/PI3K, p‐Akt/Akt, p‐mTOR/mTOR, p‐P70S6K/P70S6K, Beclin‐1/β‐actin, LC3B/β‐actin, p62/β‐actin, Bcl‐2/Bax, and cleaved caspase‐3/β‐actin. All data presented are means ± SEM; N = 5 per group. *P < 0.05, significantly different from control; # P < 0.05, significantly different from Model group
