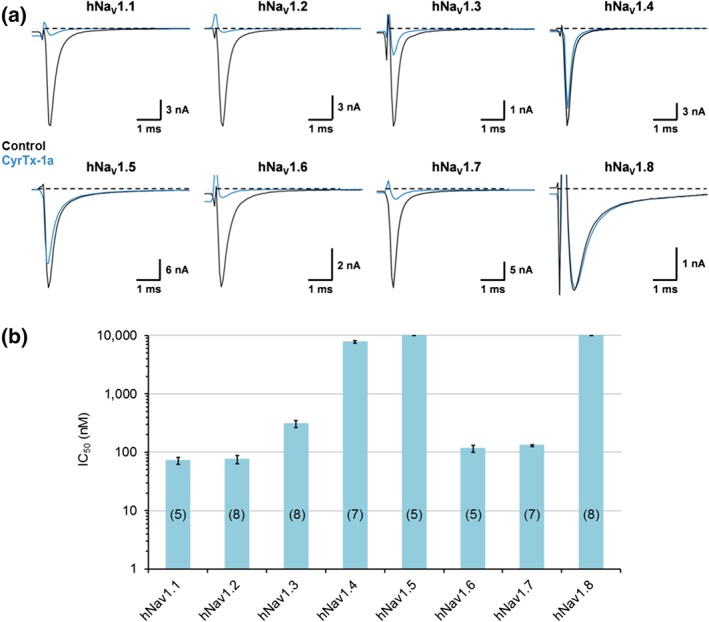
Figure 5.

Effects of CyrTx‐1a on HEK‐293 cells overexpressing hNaV1.1–1.8 channels, using whole‐cell automated patch‐clamp. (a) Representative traces of sodium currents flowing through hNaV1.1–1.8 channels, recorded before (control) and after exposure to 1 μM CyrTx‐1a. (b) Histograms of IC50 values obtained from the concentration–response curves of CyrTx‐1a effects on HEK‐293 cells overexpressing hNaV1.1–1.8 channels. Each value represents the mean ± SD of data obtained from n cells (numbers in parentheses). Mean value ± SD of n H was 1.0 ± 0.3
