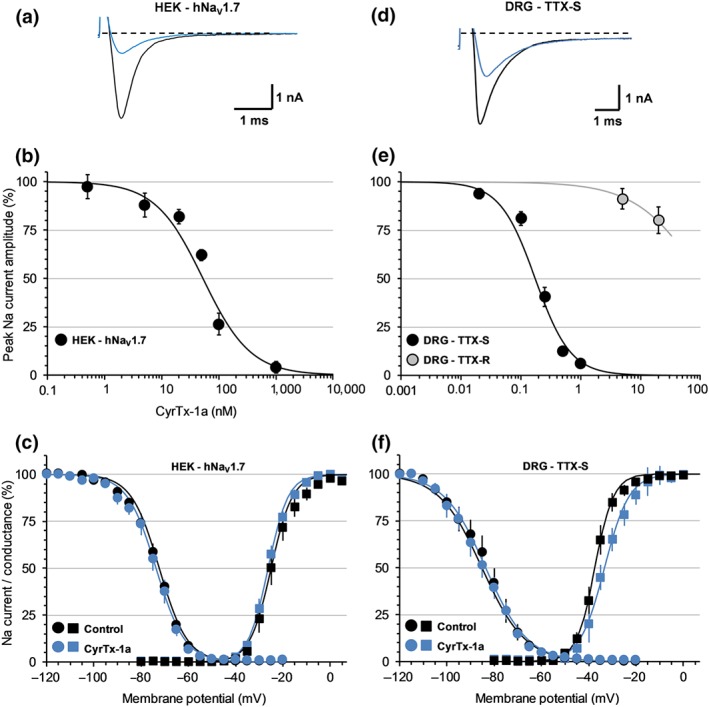
Figure 6.

Effects of CyrTx‐1a on HEK‐293 cells overexpressing hNaV1.7 channels (a–c) and on TTX‐S and TTX‐R sodium currents of adult mouse DRG neurons (d–f), using whole‐cell manual patch‐clamp. Representative traces of sodium currents flowing through hNaV1.7 channels (a) and of TTX‐S sodium currents of DRG neurons (d), recorded before (black) and after (blue) exposure to 100 and 250 nM CyrTx‐1a, respectively. Concentration–response curves of CyrTx‐1a effects on hNaV1.7 channel current (b) and on TTX‐S and TTX‐R sodium currents of DRG neurons (e). Each value, expressed as percentage of that obtained before toxin application, represents the mean ± SD of data obtained from five HEK‐293 cells and five DRG neurons from four different cell cultures. IC50 and n H values were, respectively, 52.7 nM and 1.0 for hNaV1.7 current (r 2 = 0.954), 0.17 μM and 1.5 for TTX‐S current (r 2 = 0.961), and 156 μM and 0.7 for TTX‐R current (r 2 = 1.000). Steady‐state inactivation‐ (circles) and conductance‐ (squares) voltage relationships for HEK‐293 cells overexpressing hNaV1.7 channels (c) and for neurons having TTX‐S current (f), before and after exposure to 50 nM and 0.25–0.5 μM CyrTx‐1a, respectively. Each value represents the mean ± SD of data obtained from five HEK‐293 cells and eight DRG neurons from four different cell cultures and is expressed as percentage of either maximal peak amplitude of current at strongly negative pre‐pulse voltages or maximal conductance calculated at strongly positive test voltages. The theoretical curves correspond to data point fits with the mean V P50%, k h, V T50%, and kg values indicated in Table S3
