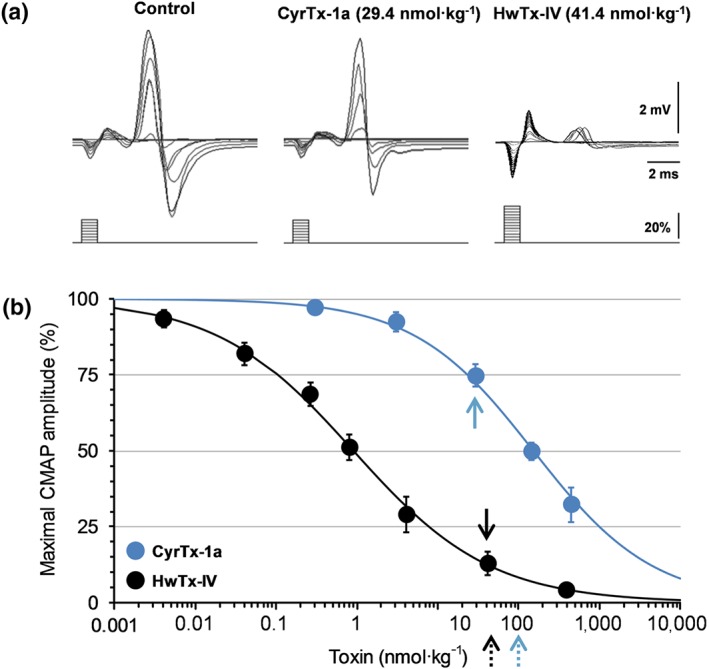
Figure 8.

Effects of CyrTx‐1a and HwTx‐IV on the CMAP recorded in vivo from mouse tail muscle in response to caudal motor nerve stimulation. (a) Superimposed traces of CMAP following increasing intensities of stimulation (scheme), before (control), and after CyrTx‐1a (29.4 nmol·kg−1, full blue arrow in (b)) or HwTx‐IV (41.4 nmol·kg−1, full black arrow in (b)) injection. (b) Concentration–response curves of the effects of CyrTx‐1a and HwTx‐IV on the maximal CMAP amplitude. Each value, expressed as percentage of that obtained before injection, represents the mean ± SD of data obtained from four (CyrTx‐1a) and five (HwTx‐IV) mice. IC50 and n H values were, respectively, 152.3 nmol·kg−1 and 0.6 for CyrTx‐1a (r 2 = 0.992) and 0.9 nmol·kg−1 and 0.5 for HwTx‐IV (r 2 = 0.998). The dashed arrows indicate the toxin concentrations used for hot‐plate and von Frey assays
