Figure 1.
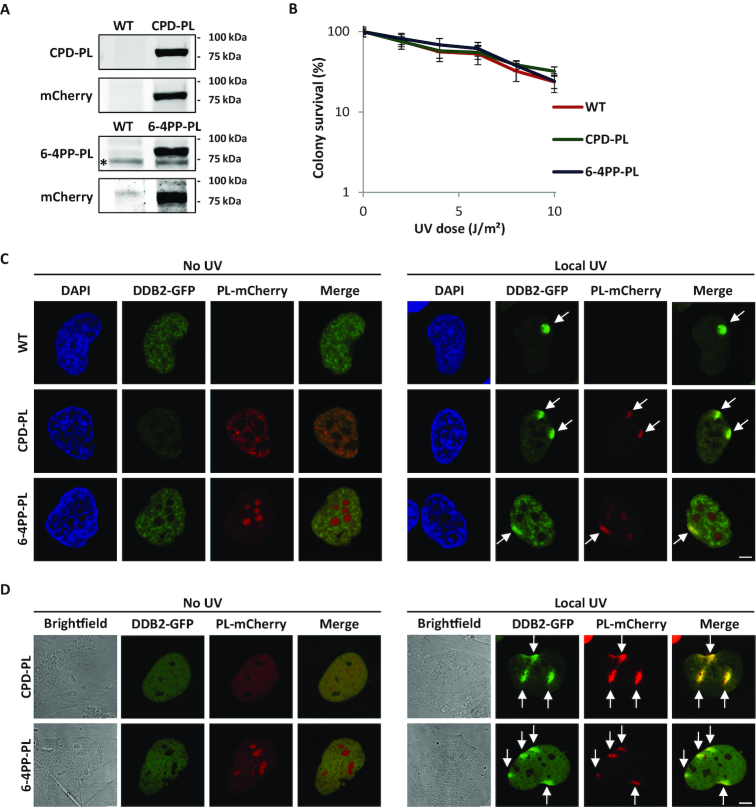
Characterization of mCherry-tagged photolyase-expressing cells. (A) Western blot of lysates of VH10 cells stably expressing GFP-DDB2 (WT), or co-expressing GFP-DDB2 and either CPD-PL-mCherry (CPD-PL, upper panel, expected size 75kDa) or 6-4PP-PL-mCherry (6-4PP-PL, lower panel, expected size 85kDa). Blots were stained with the indicated antibodies. Relevant marker sizes are indicated and * indicates an unspecific band. (B) UV-C sensitivity of WT or PL-expressing VH10 cells, determined by colony-forming ability (mean ± SEM). Percentage of surviving cells is plotted against the applied UV-C dose, colony number at 0 J/m2 is set at 100%. (C and D) Representative images of WT and PL-expressing VH10 cells. Cells were either non-irradiated (no UV, left panel) or locally irradiated with 60 J/m2 UV-C (Local UV, right panel). Cells were either fixed directly after DNA damage induction (C) or monitored directly by live cell imaging (D). Arrows indicate local UV damage. Scale bar: 5 μm.

