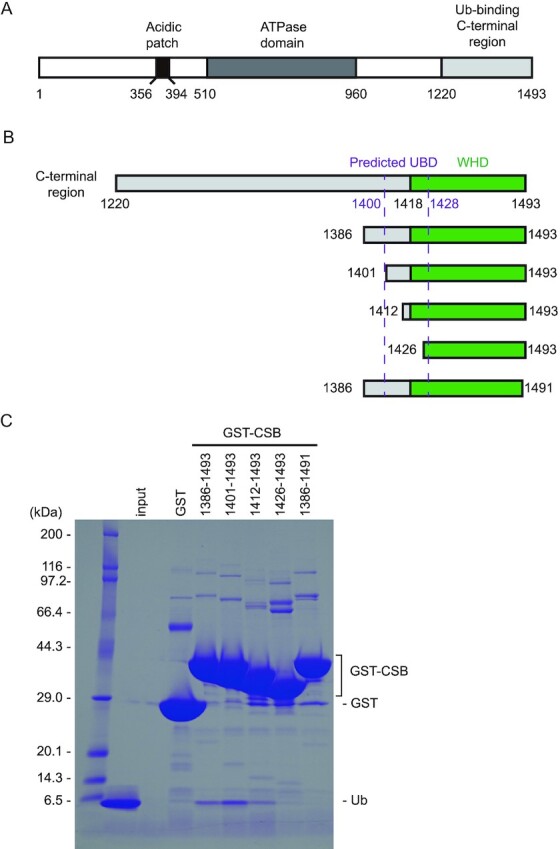
Figure 1.

Identification of the minimal Ub-binding domain of CSB. (A) Schematic view of the domain composition of human CSB. The N-terminal acidic patch, ATPase domain, and Ub-binding C-terminal region are shown as black, dark gray and light grey boxes, respectively. (B) Schematic view of CSB constructs used for identification of the minimal Ub-binding domain of CSB. WHD is shown as green boxes. The predicted UBD is delimited by dotted purple lines. (C) Pull-down assays between Ub and the CSB constructs shown in B. The bound Ub molecules were analyzed by SDS-PAGE with Coomassie brilliant blue staining.
