
Figure 7.
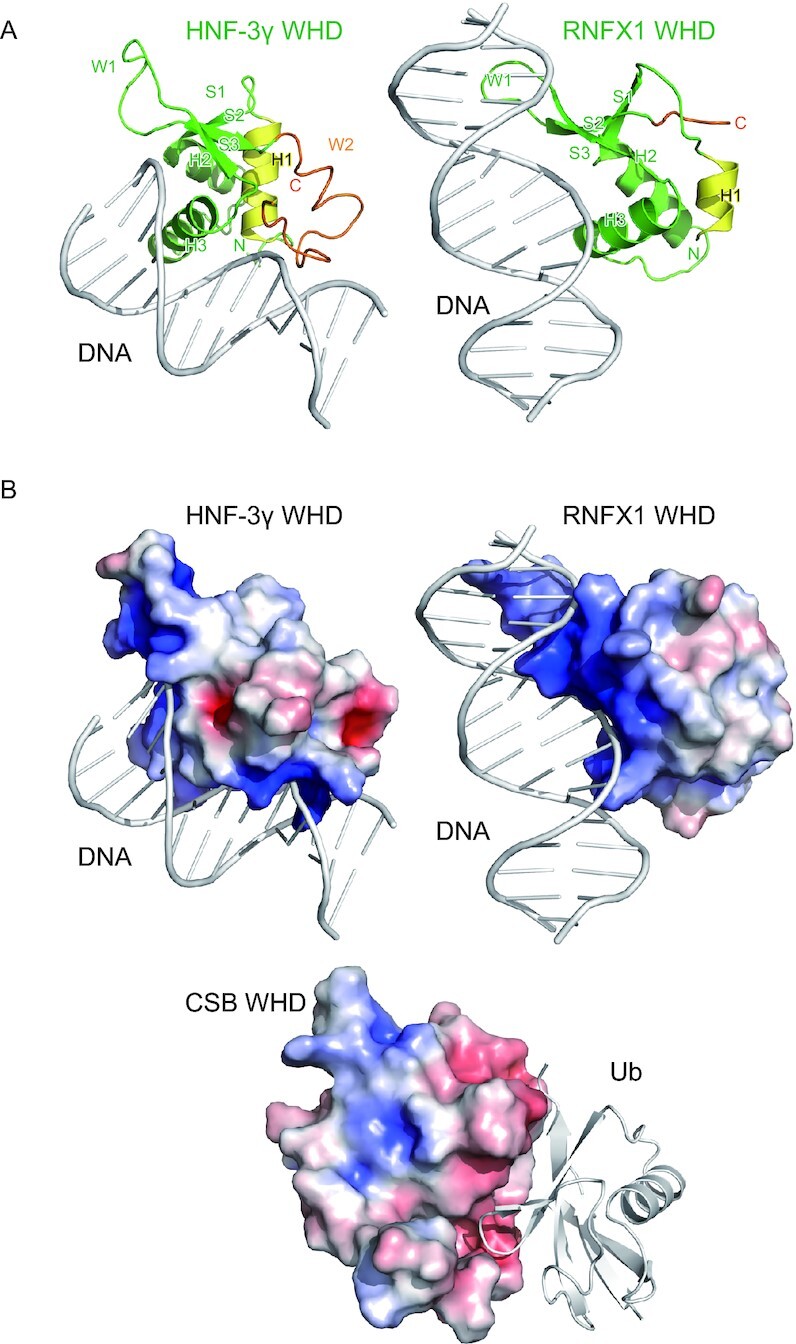
Comparison with DNA-binding WHDs. (A) Crystal structures of the DNA-bound HNF-3γ WHD (PDB 1VTN) and RFX1 WHD (PDB 1DP7). The coloring scheme of the WHDs is based on that in Figure 2. The DNA molecules are colored white. (B) Electrostatic surface potentials of CSB WHD, HNF-3γ WHD and RFX1 WHD on a scale from −5 kBT/e (red) to +5 kBT/e (blue). Interacting DNA or Ub are also shown as white cartoon models.