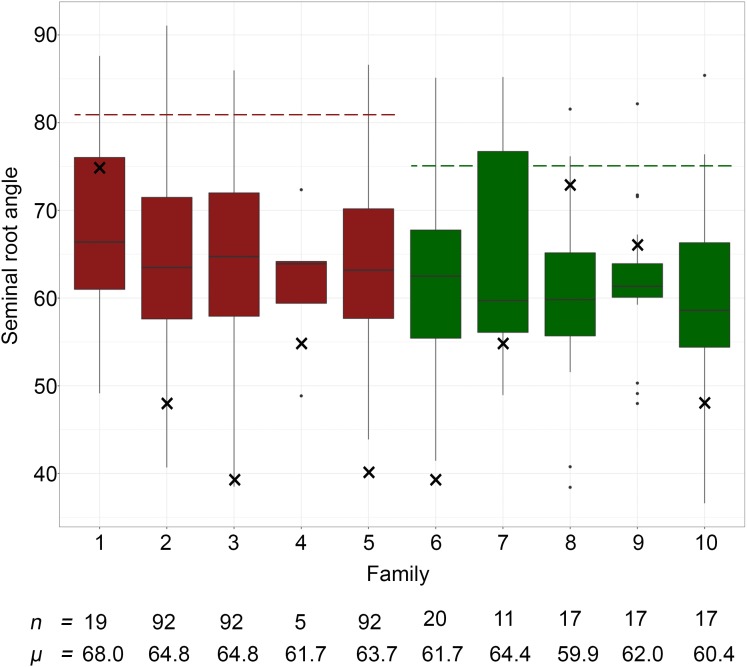
FIGURE 3.
Seminal root growth angle measurements of the 10 NAM families. Families 1 to 5 (red) share DBA Aurora as the common parent, and families 6–10 (green) share Jandaroi as the common parent. Family 1 = DBA Aurora × Fastoz7; Family 2 = DBA Aurora × Outrob4; Family 3 = DBA Aurora × Fastoz8; Family 4 = DBA Aurora × Fadda98; Family 5 = DBA Aurora × Fastoz3, Family 6 = Jandaroi × Fastoz8; Family 7 = Jandaroi × Fastoz10; Family 8 = Jandaroi × Fastoz6; Family 9 = Jandaroi × Fastoz2; Family 10 = Jandaroi × Outrob4. Boxplots display the quartile range and median SRA (horizontal line) of individuals within each of the 10 sub-NAM populations. The broken red line displays the mean SRA value of DBA Aurora and the broken green line displays the mean SRA value of Jandaroi; × represents the mean SRA value of ICARDA founder lines; n represents the number of individuals in each family; μ represents the mean SRA value of each family.

