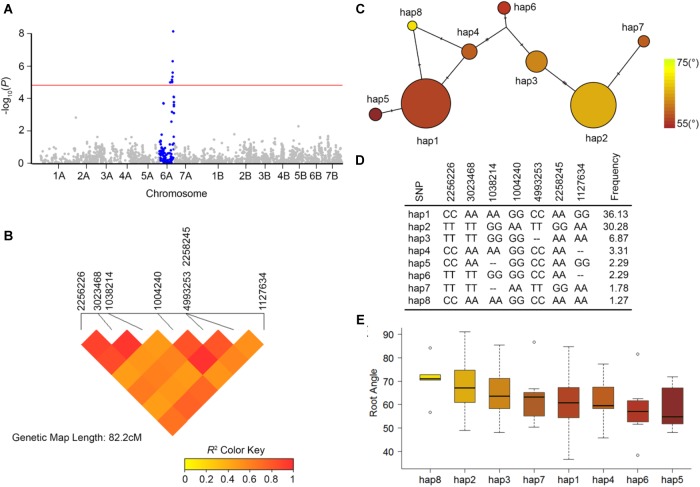
FIGURE 4.
Genome-wide association mapping for seminal root angle in 393 durum lines using 2,541 high quality DArTseq markers (minor allele frequency > 5%). (A) Manhattan plot showing chromosome 6A (blue) with significant marker-trait association at Bonferroni significant threshold 4.67 (red horizontal line). The x-axis displays the DArTseq markers on 14 chromosomes; y-axis is the –log10(P). (B) Heat map showing pairwise linkage disequilibrium (LD) between 7 significant markers representing major seminal root angle QTL on chromosome 6A (qSRA-6A). Color gradient represents LD as r2. (C) Haplotype network of 8 haplotype variants of the qSRA-6A that were found in the 393 NAM lines. Size of the circles represents the frequency of each haplotype in the population. Node color indicates mean seminal root angle for lines carrying the haplotype. (D) Allelic marker-combination of the 8 haplotypes for the 7 DArTseq markers and the frequency value of each haplotype. (E) Seminal root angle variation in each haplogroup.

