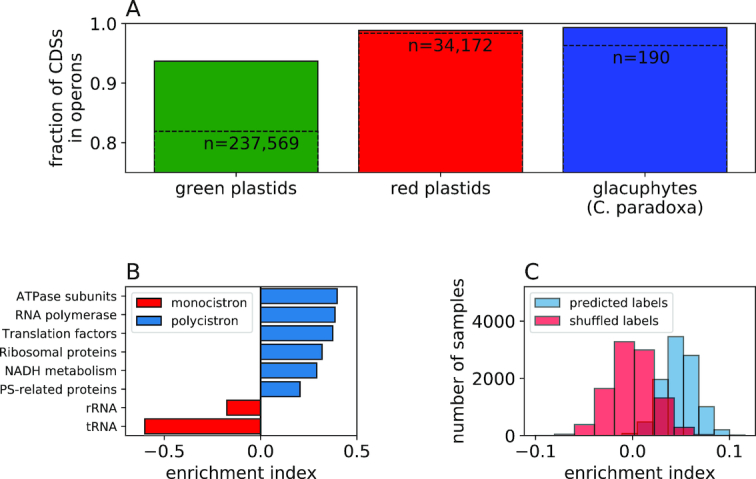
Figure 4.

General traits of plastid primary transcripts. (A) The fraction of CDSs and total genes (dashed line) found in operons in green plastids, red plastids and glacuphytes. All differences return a non-significant empiric P-value of >  (see ‘Materials and Methods’ section: Empiric P-value). The total number of genes sampled in each group is given above the relevant bar. The bars show mean ± SE. (B) Operon enrichment in different gene classes. Additionally, a hypergeometric enrichment/depletion P-value was computed for each group; P < 10−300 for all groups. (C) The distribution of functional enrichment in operons for 10 000 random samples shown in contrast to the same analysis carried on randomized data (see legend). Z-score and P-value (a two-tailed Wilcoxon test) between predicted labels and shuffled labels are 2.2 and
  , respectively.
