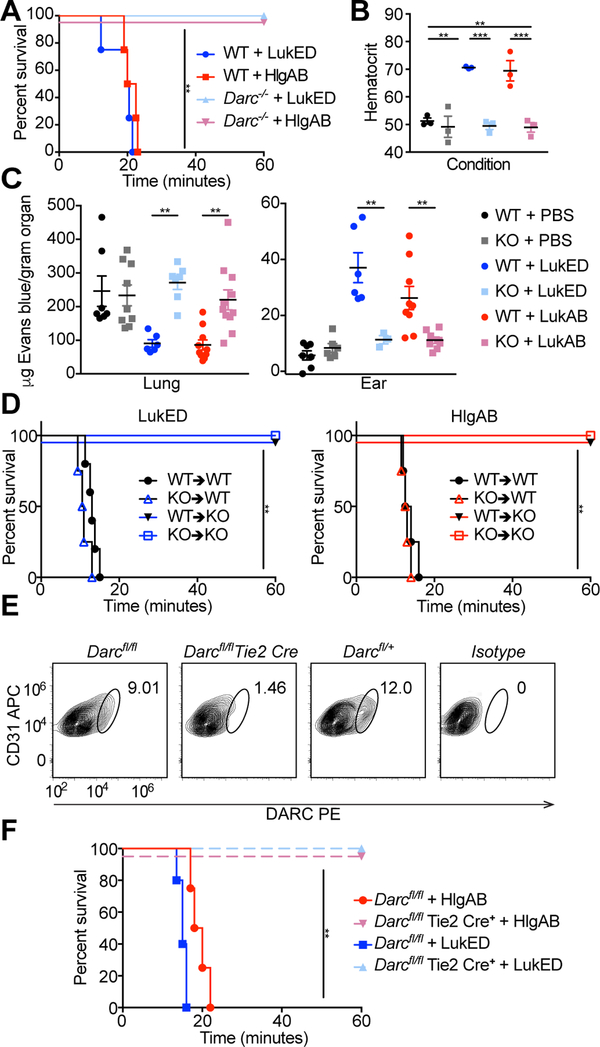
Figure 2: LukED and HlgAB target endothelial DARC to cause lethality during challenge.
(A) Survival curve of toxin challenged C57BL/6J WT and Darc−/− mice (n = 4–5 mice per group). See also Table S1. (B) Hematocrit of toxin challenged mice (n=3 mice per group). (C) Evans blue content in lungs (left) and ears (right) of toxin challenged WT and Darc−/− mice (n = 3–11 mice per group). (D) Survival curves of toxin challenged bone marrow chimeric mice (n = 4–6 mice per group). See also Figure S2A–D. (E) DARC staining of endothelial cells from the skin of Darcfl/fl and Darcfl/fl Tie2 Cre mice. See also Figure S2F–H. (F) Survival curve of toxin challenged Darcfl/fl and Darcfl/fl Tie2 Cre mice (n = 4–5 mice per group). KO=Darc−/−, bone marrow chimeras annotated as donor → recipient. Data shown are pooled from (A, B, C, D, F), or representative of (E) at least two independent experiments. Where relevant, means ± SEM are shown. ** p<0.01, *** p<0.001.

