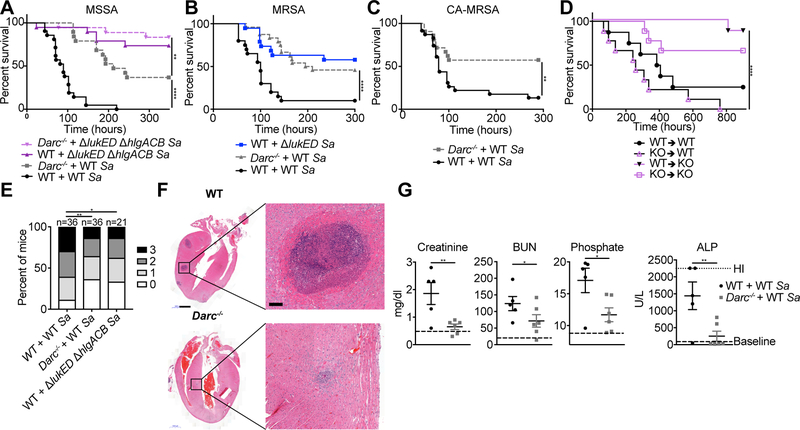
Figure 4: LukED and HlgAB target nonhematopoietic DARC to cause lethality during infection.
Survival curves of C57BL/6J (WT) and Darc−/− mice infected with 2–3.5 × 10⁷ CFU of the indicated strains of S. aureus Newman (A), 1–2.7 × 10⁷ CFU of S. aureus USA500 BK2395 (B), and 0.9–1.3 × 10⁷ CFU of S. aureus LAC (C) (n = 18–24 mice per group). See also Figure S4A, B. (D) Survival curve of bone marrow chimeric mice infected with 1–2 × 10⁷ CFU WT S. aureus Newman (n = 8–9 mice per group). See also Figure S2E. (E) Scoring of kidney pathology from 72–96 hpi of WT and Darc−/− mice infected with 2–3.5 × 10⁷ CFU of S. aureus Newman. (F) H&E staining of hearts and (G) Serum levels of analytes in mice at 96 hpi with 2.5 × 10⁷ CFU of S. aureus Newman. Scale bar in (F) is 1 mm, 100 μm in the magnified images. See also Figure S4C–F. “Baseline” in (G) is the average values for WT and DARC KO mice mock infected (mock infected WT and DARC KO mice had similar values of all analytes measured, See also Table S2). BUN = Blood Urea Nitrogen, ALP = Alkaline Phosphatase. Sa = S. aureus, KO = Darc−/−. Data are pooled from (A-E, G) or representative of (F) at least two independent experiments. Where relevant, means ± SEM are shown. * p<0.05, ** p<0.01, *** p<0.001, ****p<0.0001 (A, B, C, D Mantel-Cox test, E, two-tailed linear-by-linear association test, G, one-tailed student’s t-test).

