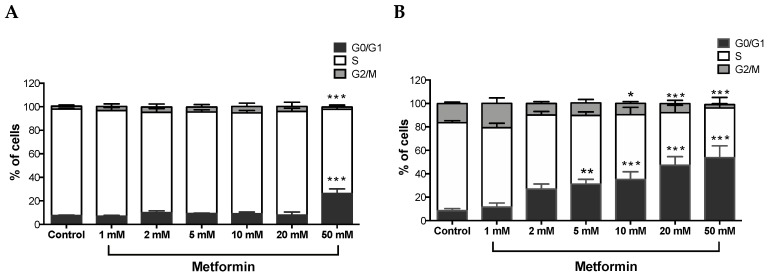
Figure 2.
Metformin-induced G0/G1 cell cycle arrest in Caki-1 and Caki-2 cells. Cell cycle progression was analyzed in (A) Caki-1 and (B) Caki-2. Cells were incubated in the absence (control) or presence of metformin (1, 2, 5, 10, 20, and 50 mM) for 48 h. Histograms represent the percentage of cells measured at each of the different phases of the cell cycle in each treatment group. Data are presented as mean ± SEM and were analyzed by two-way ANOVA, followed with Tukey’s multiple comparison tests (n = 4–6 per group). * P < 0.05; ** P < 0.001; and *** P < 0.0001 vs. control.

