Figure 4.
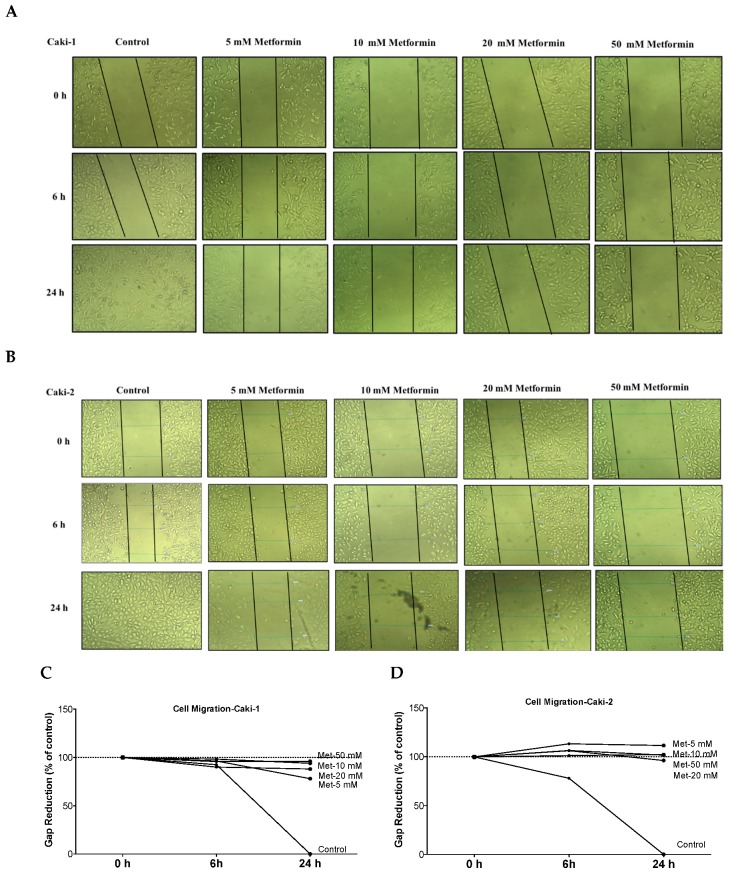
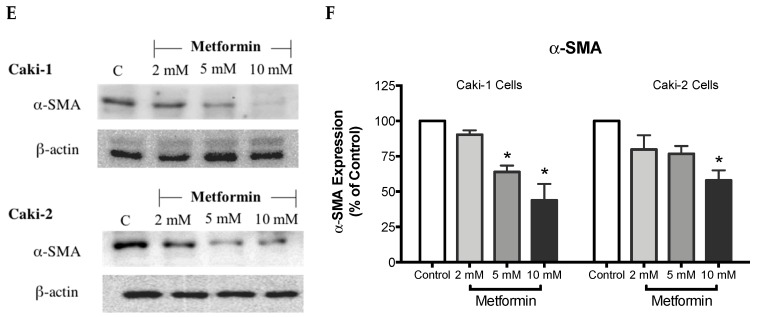
Metformin inhibited cell migration and invasion in both Caki-1 and Caki-2 cells. In vitro scratch migration assay at 0, 6 and 24 h following metformin treatment (5, 10, 20, and 50 mM) are shown in (A) Caki-1 cells (B) and Caki-2 cells. Images are representative of three independent experiments in each group. Pooled quantified normalized data expressed as gap reduction (percentage of control) is presented for (C) Caki-1 and (D) Caki-2. (E) Western blot analysis of the expression of α-SMA in Caki-1 and Caki-2. Images are representative of n = 4–5 per group. (F) Histograms represent pooled densitometry data normalized to β-actin expressed as the percentage of control. Data are presented as mean ± SEM. * P < 0.05 vs. control.


