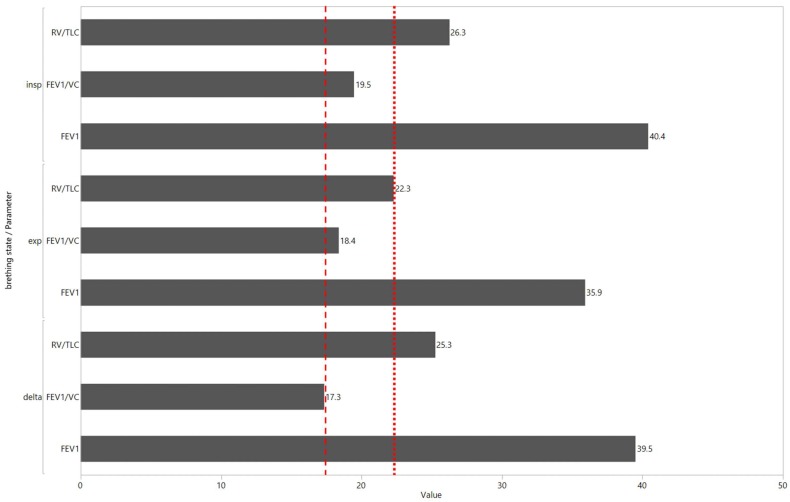
Figure 2.
Mean relative errors of the polynomial regression for all datasets (inspiration, expiration, delta) and predicted parameters. The dotted and dashed line mark the distinct differences in prediction performance with regard to the expiration and delta scan for the FEV1/VC and RV/TLC, respectively.

