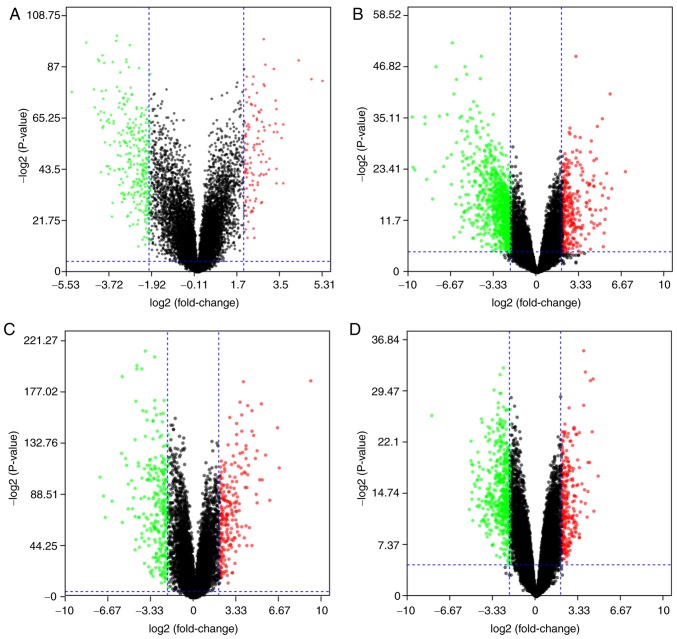
Figure 1.
Differential expression of genes between cancerous and non-cancerous samples in the datasets (A) GSE37991, (B) GSE23558, (C) GSE30784 and (D) GSE56532. The red data-points represent upregulated and the green ones represent downregulated genes screened on the basis of |fold change|>2.0 and a corrected P-value of <0.05. The black data-points represent genes with no significant difference in expression. The datasets were obtained from the Gene Expression Omnibus database.

