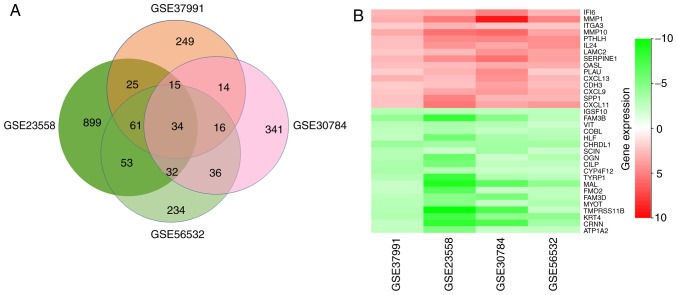
Figure 2.
Identification of DEGs. (A) Venn diagram of the DEGs in the 4 datasets. A total of 34 DEGs were included in all 4 data sets. (B) LogFC heatmap image of the 34 commonly changed DEGs of the 4 datasets. The 4 GEO datasets are denoted on the abscissa and the gene names are displayed on the ordinate. Red represents logFC>0, green represents logFC<0. DEG, differentially expressed gene; FC, fold change.

