Figure 5.

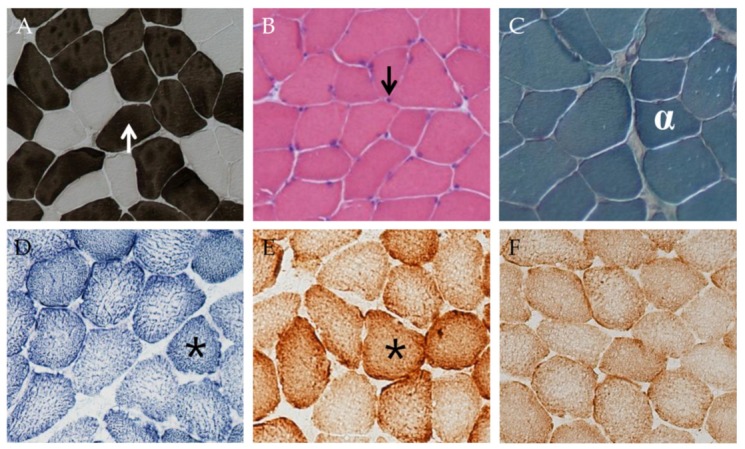
Sections of the lateral vastus muscle in the same subject after training stained for (A) adenosine triphosphatase (ATPase) pH 4.3, (B) haematoxylin & eosin (H&E), (C) trichrome, (D) succinic dehydrogenase (SDH), (E) cytochrome oxidase, and (F) COX/SDH. The white arrow (↑) shows the darkly stained type I fibers of the ATPase pH 4.3 stain. The black arrow (↓) shows myonuclei stained with H&E. White alpha (α) shows the darkly stained type I fiber (containing many mitochondria) with the trichrome stain. Black stars (*) show the darkly stained type I (high content of SDH and COX enzymes) with the SDH and COX stains. In (F), fibers devoid of cytochrome oxidase activity would appear blue. The ATPase stains showed that fiber type distribution and size did not change with training or detraining. There were few examples of regenerating cells, as indicated by centrally located nuclei, and no inflammation seen with the H&E staining. Staining with SDH, COX, COX/SDH, and trichrome showed no abnormalities either prior to or after training, indicating no mitochondrial dysfunction. Notice in (D) and (E) how the peripheral circumference of the type I fibers in some places stains significantly darker than central areas. This indicates a higher density of clustered subsarcolemmal mitochondria relative to the intermyofibrillar mitochondria.
