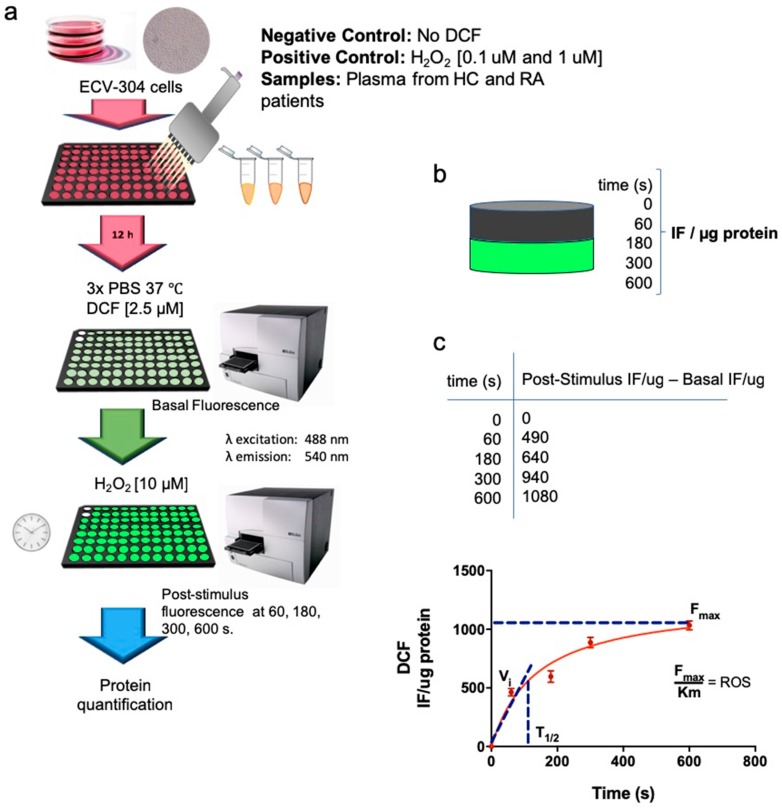
Scheme 1.
ROS production was measured in ECV-304 cells cultured with plasma from healthy controls and patients with RA. (a) ECV-304 cells were cultured in 96 well plates prior plasma incubation. Then, plasma from healthy controls and patients with RA was incubated for 12 h at 37 °C 5% CO2. Each plate contained a negative control (No DCF) and two positive controls [H2O2 0.1 mM and 1 mM]. ECV-304 cells were then washed with PBS and cultured with 2.5 μM DCF for 30min at 37 °C 5% CO2. Fluorescence intensity was then measured using a microplate reader at emission 540 nm (excitation 488 nm). The basal fluorescence intensity was measured prior H2O2 [10 mM] stimulation. Then, the plate was activated with H2O2 [10 mM] and the fluorescence signal of intracellular ROS production was measured at 60, 180, 300 and 600 s. Finally, protein concentration from each well was quantified after ROS measurement. (b) Fluorescence intensity per sample was normalized by total protein concentration on each well. (c) Fluorescence intensity at 0 s (basal level) was subtracted from fluorescence intensity at 0, 60, 180, 300 and 600 s post-activation with H2O2 [10 uM] and tabulated to calculate the kinetics parameters of ROS production. Maximum fluorescence intensity (Fmax) and Km for each sample was obtained according to Michaelis-Menten equation. Final values were obtained by dividing the maximum fluorescence intensity (Fmax) by Km (t1/2).

