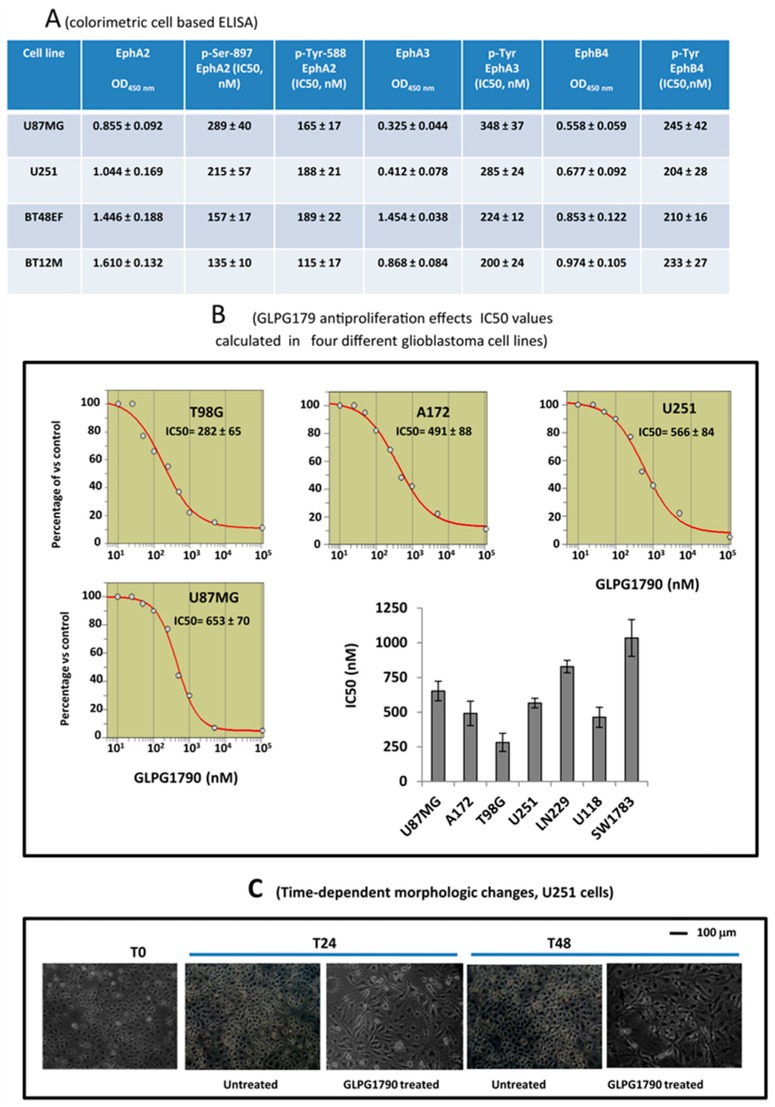
Figure 1.
Biochemical and cellular effects of different doses of GLPG1790. (A) Colorimetric cell-based ELISA determinations for total and phosphorylated Tyr588 and Ser897 EphA2, total and phosphorylated Tyr779 EphA3 and total and phosphorylated Tyr987 EphB4 in GLPG1790-treated U87MG cells. Data show also the IC50 values calculated for the inhibition of phosphorylation for EphA2, EphA3 and EphB4 isoforms. (B) Growth curves and IC50 determination for GLPG1790-treated A172, U251, T98G and U87MG and GBM cell lines as well as in BT48EF and BT12M GICs. (B) antiproliferative effects and IC50 values calculated for GBM cell lines. (C) Morphology of GLPG1790-treated U251 cells.

