Figure 7.
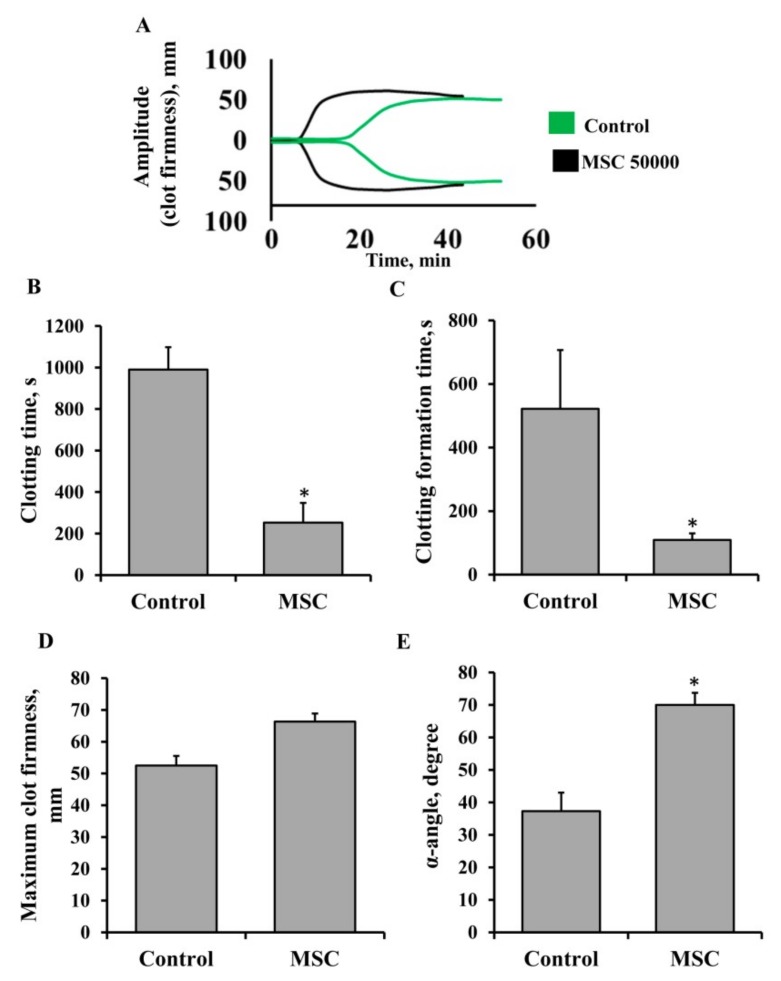
Procoagulant effects of MSCs in the whole blood of patients treated with heparin. (A) Representative thromboelastometry diagrams of clotting in whole blood from donors show a change in the clot elasticity over time depending on the addition of MSC to the sample. (B) Clotting time, (C) clot formation time, (D) maximum clot firmness, and (E) α-angle assayed by the NATEM test. MSCs were resuspended in 1 mL of freshly obtained blood at a concentration of 5 × 10⁴ cells per mL, then 300 µL of the suspension was sampled for analysis. Blood from seven patients was used, and each blood sample was incubated with MSCs from three different umbilical cord samples. * p < 0.05, Student’s t-test.

