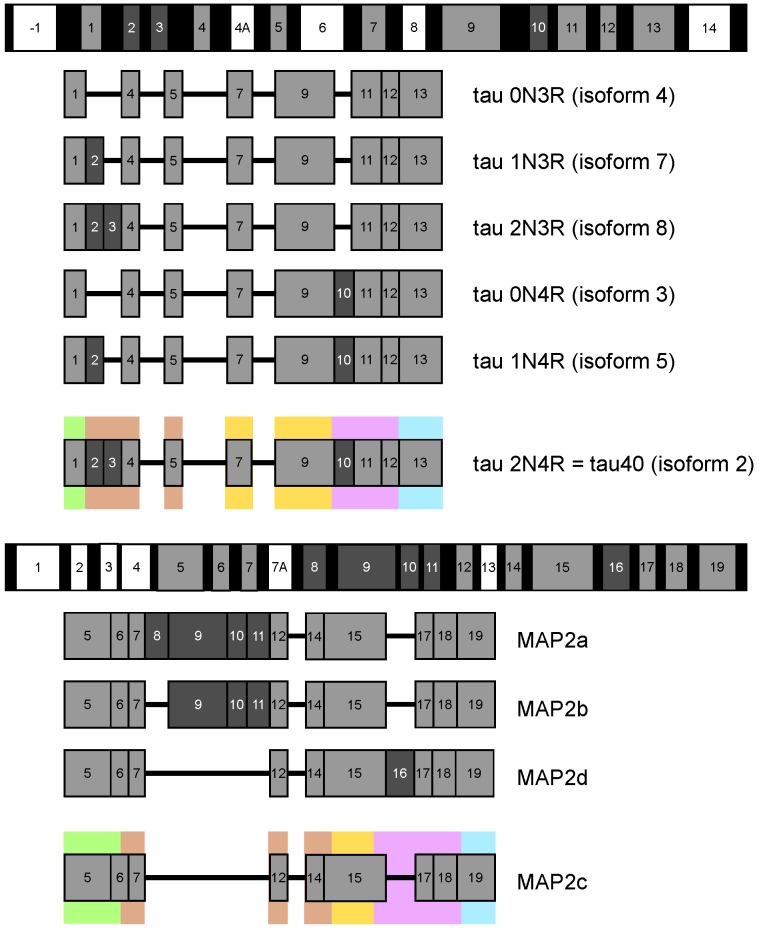
Figure 1.
Organization of the DNA sequences of tau (top) and MAP2 (bottom) and splicing isoforms expressed in brain. Exons not expressed in brain isoforms are shown in white, exons expressed in all isoforms are shown in light gray, and exons expressed in some isoforms are shown in dark gray. Regions of isoforms discussed in this review are shown in boxes of different colors. The exons of tau and MAP2 are numbered according to Cailet-Boudin et al. [4] and Sündermann et al. [45], tau isoforms are numbered according to the National Center for Biotechnology Information (NCBI) RefSeq database.

