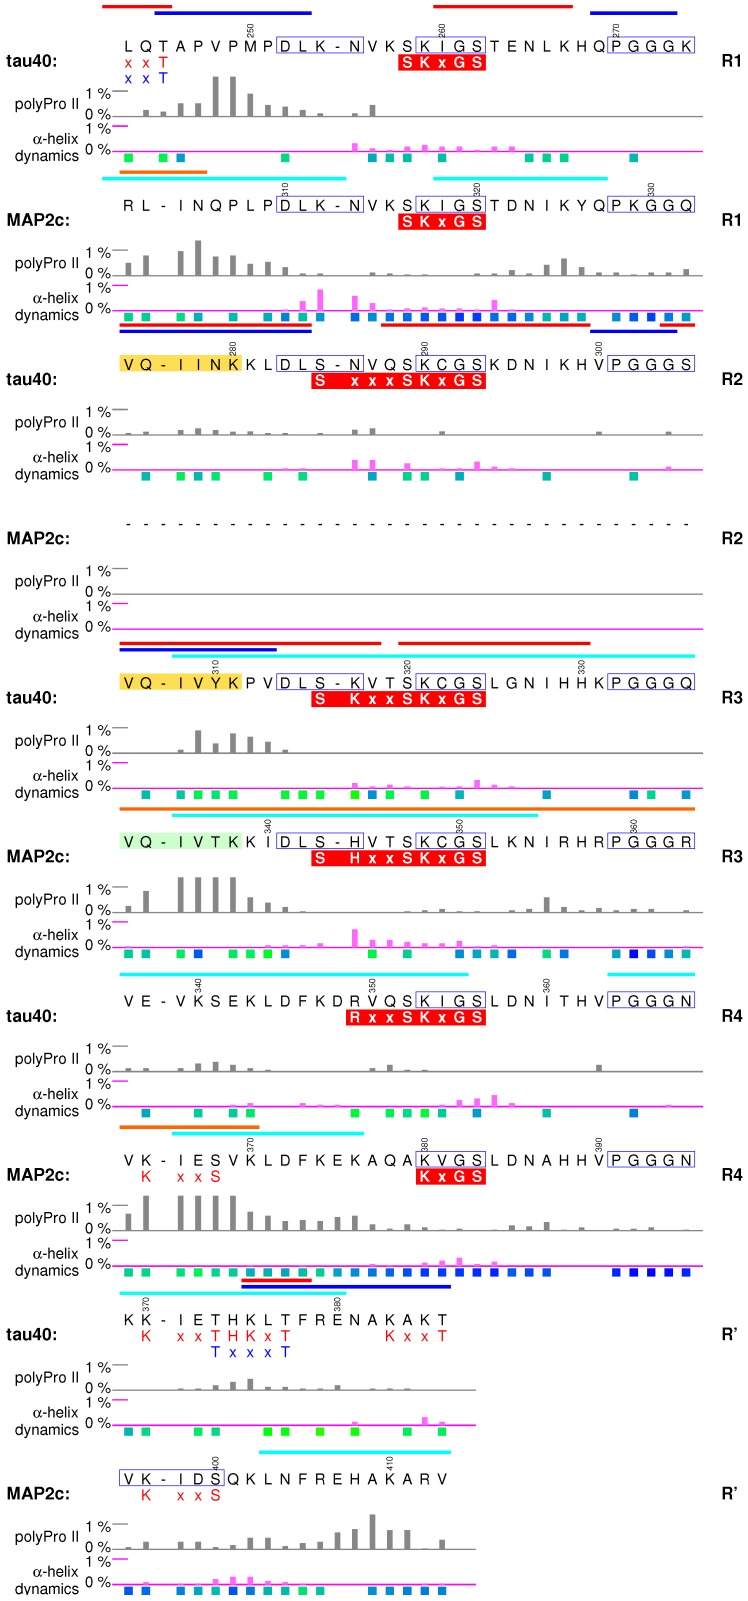
Figure 6.
MTBDs of human tau40 and rat MAP2c. MTBRs 1–4 are labeled R1–R4, respectively, the following sequence homologous with the N-terminal sequence of MTBRs is labeled R. Aggregation sites of tau40 are shown in yellow boxes and the corresponding sequence of MAP2c is shown in a pale green box. Complex phosphorylation sites including the MARK recognition motifs are shown in red boxes. Regions of tau interacting with filamentous actin are indicated by the horizontal red bars above the sequence. Other symbols are used as described for Figure 3 and Figure 4.

