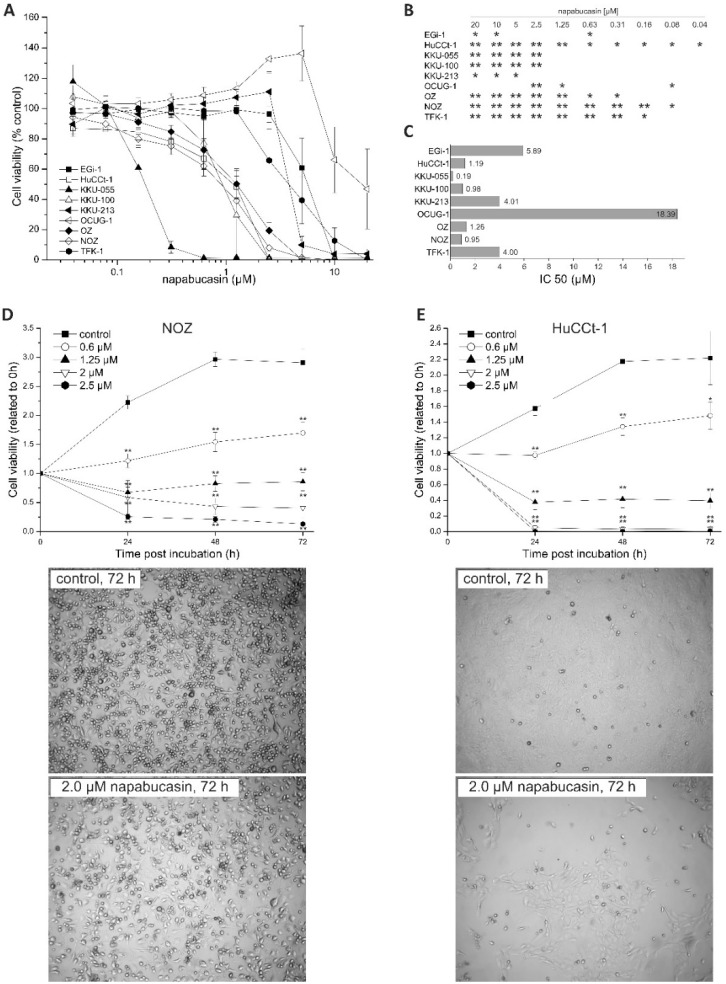
Figure 1.
(A) Cytotoxic effects of napabucasin in biliary tract cancer cells. Effects of different napabucasin concentrations on cell viability of nine biliary tract cell lines after 72 h incubation period using the resazurin assay. (B): Statistics for Figure 1A, C: half maximal inhibitory concentration (IC50) values in µM of napabucasin. (D,E) Top: Time-dependent cytotoxicity of napabucasin using 0 (control), 0.6, 1.25, and 2.0 µM on NOZ (C) and HuCCt-1 (D) cells, respectively. Viability was measured after 0, 24, 48, and 72 h via the resazurin assay and related to the initial time points (0 h) for each treatment. (D,E) Bottom: Representative images of untreated and napabucasin-treated (2.0 µM) NOZ (left) and HuCCt-1 (right) cells. Pictures were taken from the center of the 96-well plates using the microplate reader. Data are presented as mean value ± standard error of the mean (SEM) related of at least three individual biological replicates * indicates significant (p < 0.05) and ** highly significant (p < 0.01) results.

