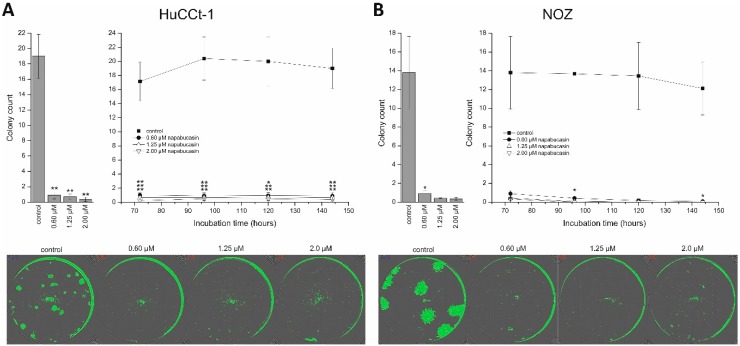
Figure 4.
Napabucasin abolishes clonogenic growth in biliary tract cancer cells. (A) Quantification of clonogenic growth of HuCCt-1 cells after 144 h napabucasin incubation (left) and as a time-resolved analysis of the same wells (right). Exemplary confluence images after 144 h of napabucasin are shown in the lower part. (B) Quantification of clonogenic growth of NOZ cells after 144 h napabucasin incubation (left) and as a time-resolved analysis of the same wells (right). Exemplary confluence images after 144 h of napabucasin are shown in the lower part. Data are presented as mean value ± SEM related to untreated control cells of at least three individual biological replicates. * indicates significant (p < 0.05) and ** highly significant (p < 0.01) results.

