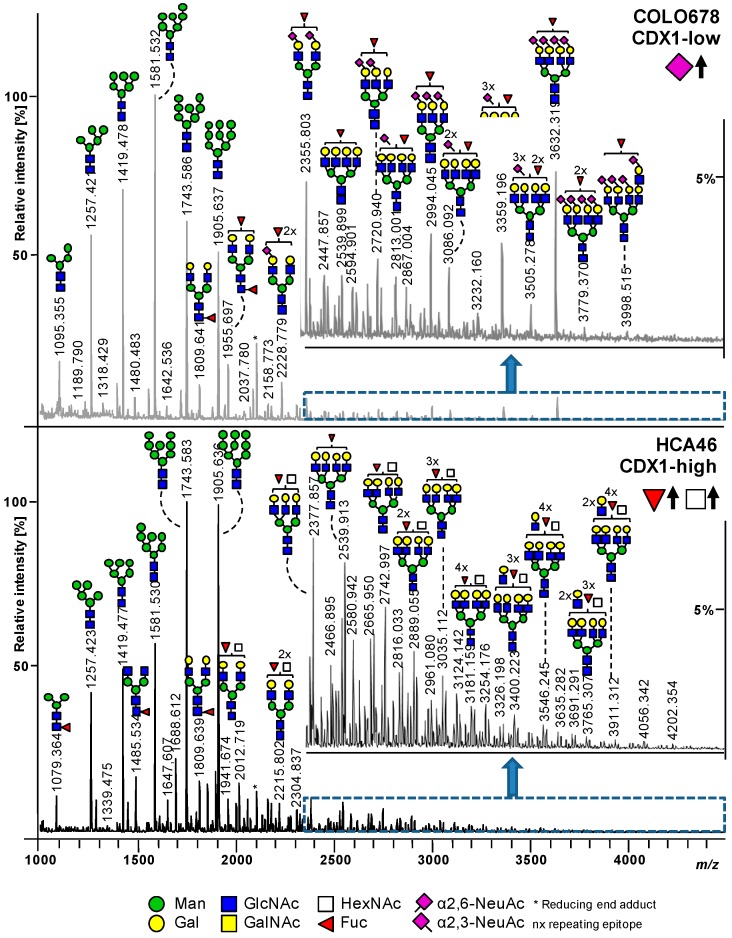
Figure 2.
Exemplary MALDI-TOF-MS spectra. MALDI-TOF-MS spectrum of CDX1-low expressing cell line COLO678 (upper spectrum), and of CDX1-high expressing cell line HCA46 (lower spectrum). Spectra were recorded in positive ion reflectron mode on a Bruker UltrafleXtreme mass spectrometer. On the y-axis, the relative intensity is given with 100% corresponding to the highest peak in each spectrum. The spectrum range of m/z 2350 to m/z 4600 is enlarged in the inset. Main peaks are annotated with glycan cartoons, representing compositions, and the presence of additional structural isomers cannot be excluded. To simplify the cartoons, repeating epitopes are indicated as “nx”. Green circle = mannose, Man; yellow circle = galactose, Gal; blue square = N-acetylglucosamine, GlcNAc; white square = N-acetylhexosamine, HexNAc; red triangle = fucose, Fuc; purple diamond = sialic acid, N-acetylneuraminic acid, NeuAc. Differences in N-acetylneuraminic acid linkages are indicated using different angles.

