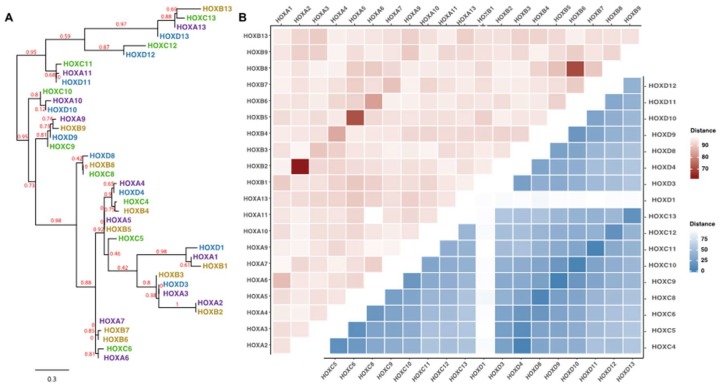
Figure 2.
Phylogenetic analysis of HOX genes. (A) Shown is a phylogram using the full-length protein sequences of the HOX family members generated by phlogeny.pr [9,10]. The bootstrap value, representing the reproducibility of the tree structure, is shown for the horizontal branches; the scale bar indicates the length representing 0.3 substitutions per site. All HOX family members from a given locus are in the same color. (B) Shown is a distance matrix comparing the full-length protein sequences from the HOXA locus to the full-length protein sequences from the HOXB locus (left top triangle; pink squares) and a distance matrix comparing the homeodomain sequences of the HOXC proteins versus the homeodomain sequences of the HOXD proteins (right bottom triangle; blue squares); matrices were created using distmat [11]. Color legend: Distance: the darker the color, the more similar are the two proteins and the lighter the color the less similar are the two proteins. The HOX sequences were retrieved from RefSeq [12] and the homeodomains were annotated using Pfam [13]. A full distance matrix comparing all 39 HOX proteins (full-length and homeodomains) is shown in Figure S1; see Table S1 for all distance values.

