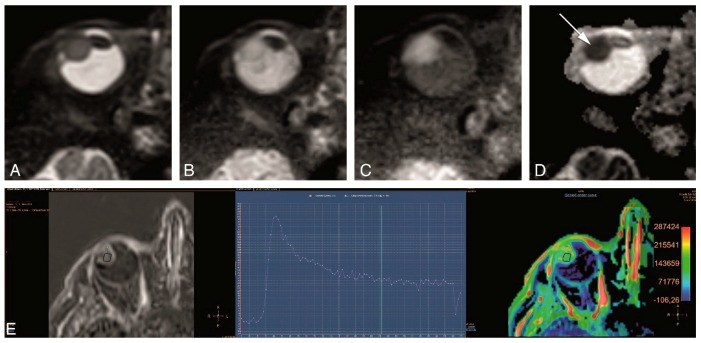
Figure 3.
(A–E). Study protocol: Functional axial MRI sequences in the same patient as in Figure 2. (A–D) TSE DWI, with b values of 0 s/mm2 (A), 400 s/mm2 (B), 800 s/mm2 (C) and Apparent Diffusion Coefficient (ADC) (D). Restricted diffusion in the uveal melanoma (arrow). (E) Dynamic Contrast-Enhanced (DCE) with a good quality, no movement artefacts, showing a wash-out TIC pattern.

