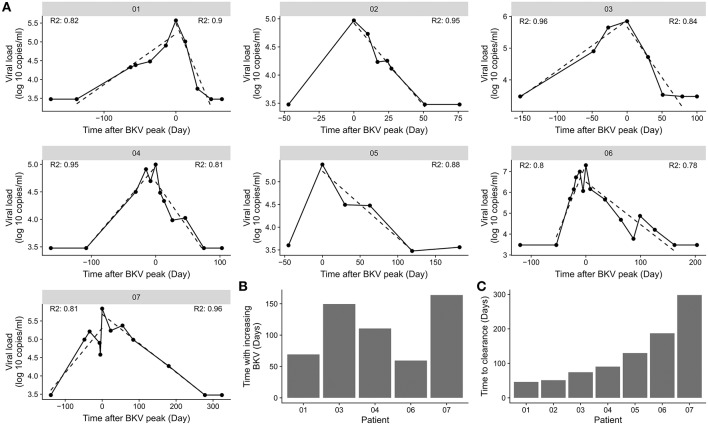
Figure 2.
Difference in BKV viremia clearance time. (A) BKV viremia remission phase for the individual patients in the cohort. The dotted line indicates the best linear fit from the time point before BKV-reactivation to highest BKV load and from the highest BKV load to the first time point with BKV viremia below detection limit. R2 indicate the goodness of fit for the time of increasing BKV viremia and for the time with decreasing viremia. (B) Association of time of increasing BKV viremia and the time to clear the virus. (C) Clearance time calculated from the slope of a straight line from the highest BKV value to the first time point with BKV viremia below detection limit.

