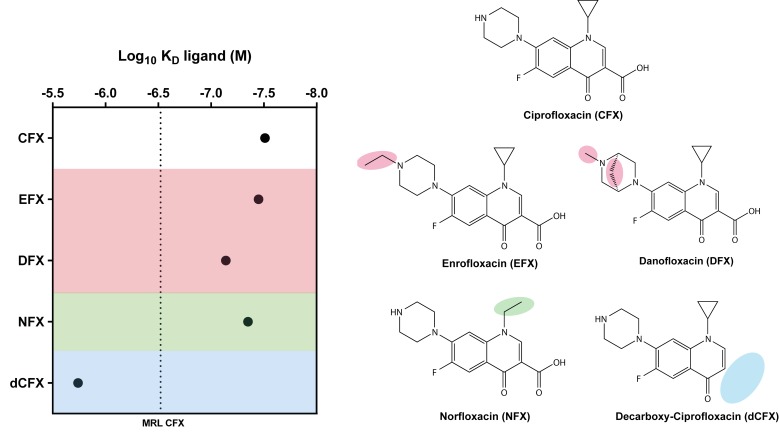
Figure 2.
Specificity of the molecular recognition of the CFX-binding aptamer R10K6 and its impact on the dissociation constant. Left: Plot of the Log10KD-values (M) of CFX and CFX-derivatives. The maximum residue limit (MRL) for CFX in milk samples is marked as a dotted line [23,24]. Right: Chemical structure of CFX and CFX derivatives. Changes relative to CFX in the chemical structure are shaded.

