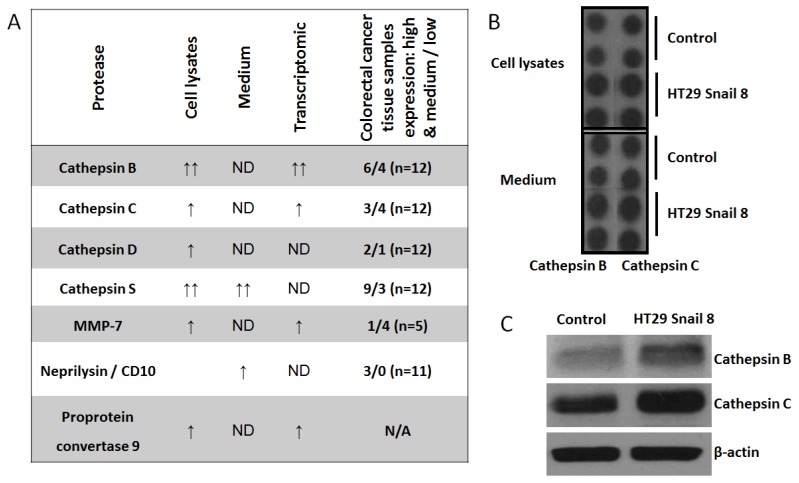
Figure 4.
The expression of non-MMPs proteases in HT-29 cells with Snail overexpression. Cell lysates and culture medium were analyzed by using Proteome Profiler Human Protease Array (R&D System, ARY021). (A) Comparative analysis of transcriptomic [9] and proteome profiler data from HT-29 cells overexpressing Snail with proteomic analysis of colorectal cancer tissue samples obtained from “The Human Protein Atlas” (https://www.proteinatlas.org). (B) Representative picture of cathepsin B and cathepsin C expression in proteome profiler dot technique analysis. Full proteome profiling was shown in Figure S2 (C) Western blot analysis of cathepsin B and cathepsin C. ND—not detected; N/A—not available.

