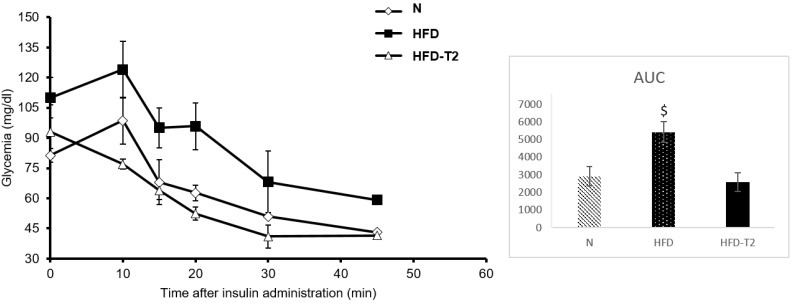
Figure 1.
Insulin Tolerance test (ITT). Glycemia after insulin administration at different time points in N, HFD, and HFD + T2 rats. Area under the curve (AUC). Values are means ± SEM of five independent experiments (N = 5) $ p < 0.05 vs. N and HFD-T2. After 10 min from insulin injection, both N and HFD showed a small but not significant increase in glucose level, but this is not surprising and can happen frequently [49].

