Figure 2.
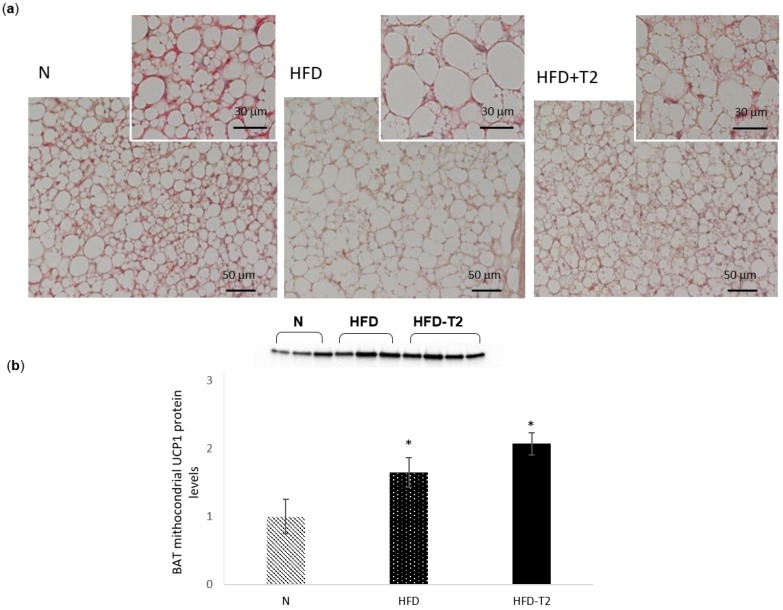
Effects of T2 administration on BAT morphology and on BAT UCP1 content. (a) Representative images (at low magnification-20×) showing different cellular organization within BAT parenchyma (haematoxylin and eosin staining). Insets: cellular shapes in the central part of the lobule in BAT parenchyma (40×), and (b) western blot analysis and quantification of the signals of UCP1 protein levels detected in the whole lysate. For total lysate, each lane contained 15 µg of protein from a single rat. Values are means ± SEM of five independent experiments (N = 5), * p < 0.05 vs. N.

