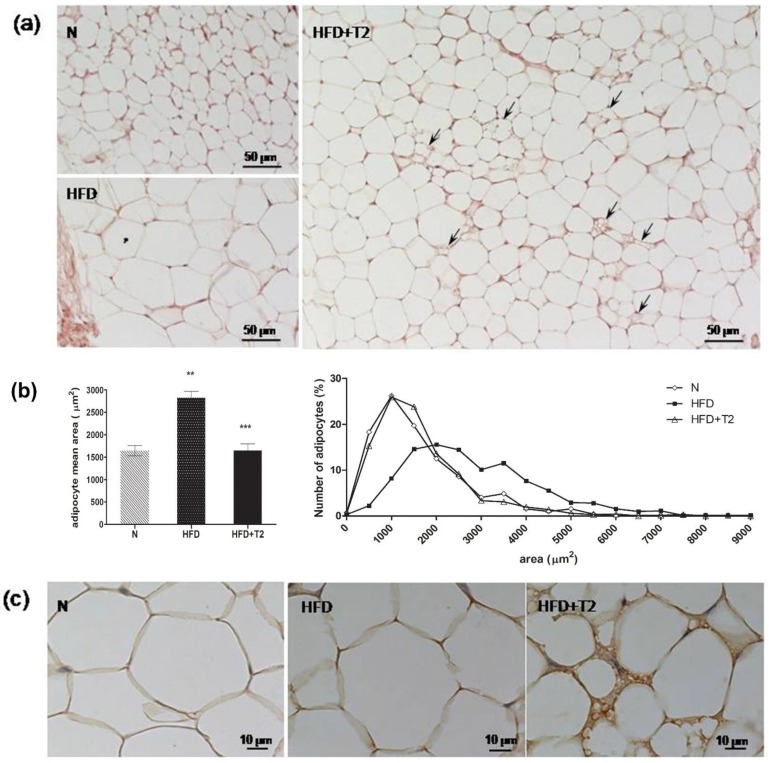
Figure 3.
Effects of T2 administration on sWAT morphology. (a) Histological analysis, (b) morphometrical analysis, and (c) UCP1 immunohistochemistry of anterior sWAT of N, HFD, and HFD+T2 rats. Adipocytes from HFD rats are significantly larger than those from N rats. After T2 administration, the mean area and frequency distribution of the adipocytes were normalized to control values. A number of UCP1-stained paucilocular adipocytes are shown (arrows and panel (c)). More than 720 adipocytes were quantified from N = 3 rats from each group. Data are presented as Means ± SEM. ** p < 0.01 vs. N; *** p < 0.001 vs. HFD.

