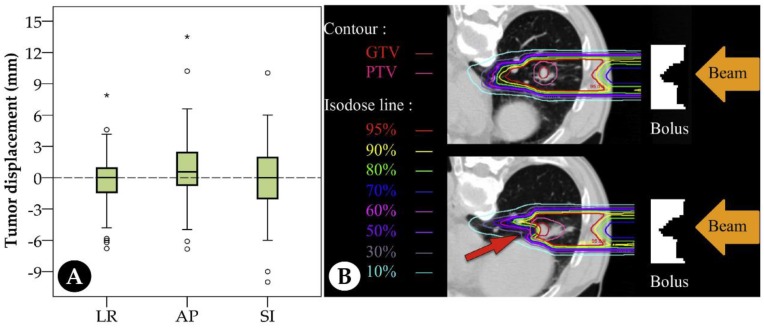
Figure 3.
Tumor displacements of 50 patients with stage I lung cancer treated at Gunma University Heavy Ion Medical Center (A). * denotes the extreme value; ° denotes the abnormal value. Compared with original treatment plan (top), dose distributions significantly decreased due to internal anatomic changes in the simulation plan (bottom) (B). Figure 3B was adapted with permission from Irie et al. [8]. Abbreviations: LR: left–right; AP: anterior–posterior; SI: superior–inferior; GTV: gross tumor volume; PTV: planning target volume.

