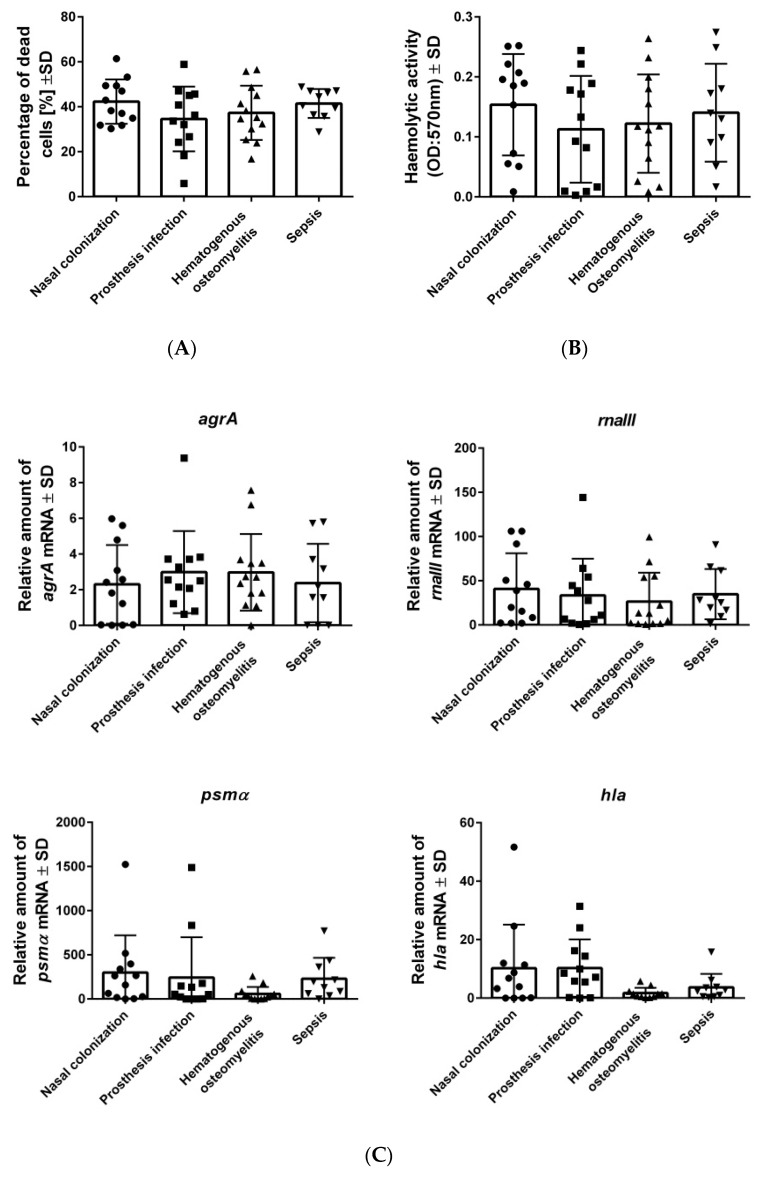
Figure 1.
High- and low-cytotoxic strains are similarly distributed among S. aureus isolates from different origins. (A) Osteoblasts were infected with clinical strains of S. aureus, and the percentage of dead cells was measured after 24 h post-infection by staining with propidium iodide and quantification by flow cytometry. (B) Hemolysis was measured by detecting the release of hemoglobin from sheep blood erythrocytes (OD: 570 nm) post-infection with S. aureus strains. (C) Gene expression of S. aureus strains. All strains were cultivated in BHI for 4 h (agrA, rnaIII) and 6 h (psmα, hla) respectively. The RNA was isolated and transformed to complementary DNA (cDNA), in order to perform qPCR. The expression of the gene gyrB was used as a reference. The bars and whiskers represent the means ±SD of three independent experiments in duplicate. The differences between all of the groups of isolates were analyzed by a one-way ANOVA test, with Tukey’s multiple comparisons test.

