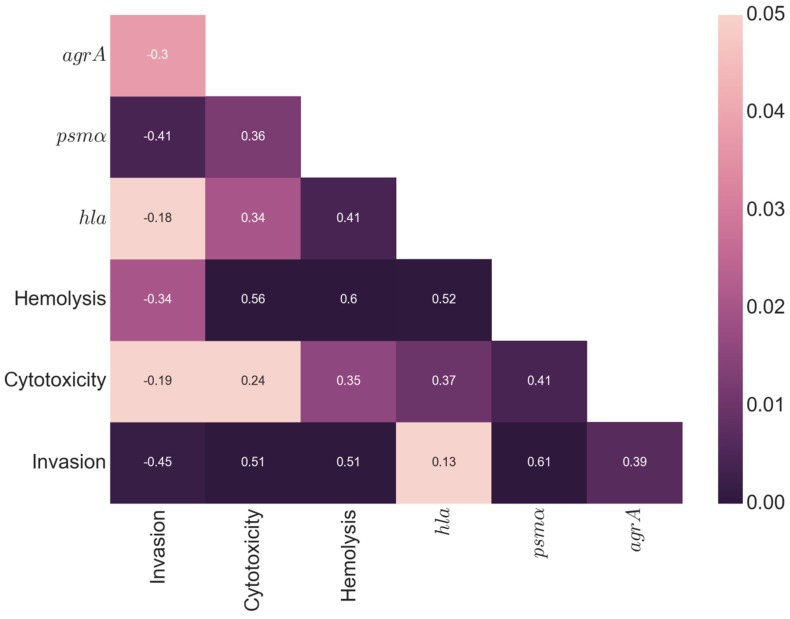
Figure 3.
Correlation analysis. Spearman’s correlation coefficients for all of the measured parameters. Significance testing of correlations was done by computing a two-sided p-value, assuming a t-distribution with two degrees of freedom. The values in the heat map are the pairwise correlation coefficients (r-values) and the colors indicate the significance level of the correlation coefficient (p values). Highly significant p-values are dark purple, and lighter colors indicate decreasing significance.

