Figure 4.
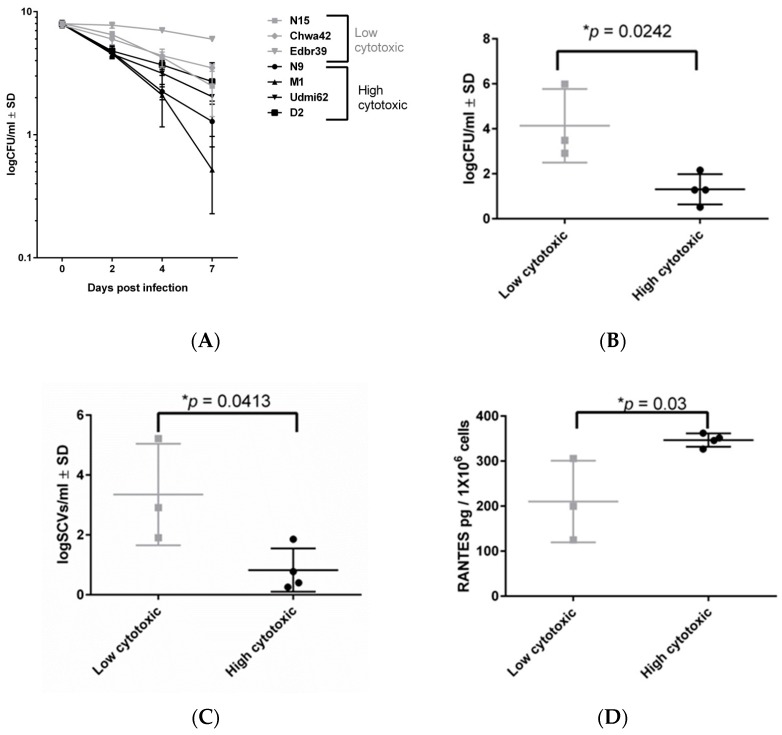
Long-term persistence of low- and high-cytotoxicity strains in osteoblasts. (A) Intracellular bacteria recovered from infected osteoblasts for four high cytotoxic strains (black lines) and three low cytotoxic strains (gray lines) as a function of time post-infection. (B) Intracellular bacteria recovered from infected osteoblasts with high- and low-cytotoxicity strains at day 7 post-infection. (C) SCVs recovered at day 7 post-infection. (D) RANTES levels were measured in the cell culture supernatant of infected osteoblasts after 24 h post-infection, using the ELISA test. All results represent the mean ±SD of at least three independent experiments. The difference between the low- and high-cytotoxicity strains was analyzed by the Unpaired t-test. (* p < 0.05; ** p < 0.01; *** p < 0.001 and **** p < 0.0001)

