Figure 1.
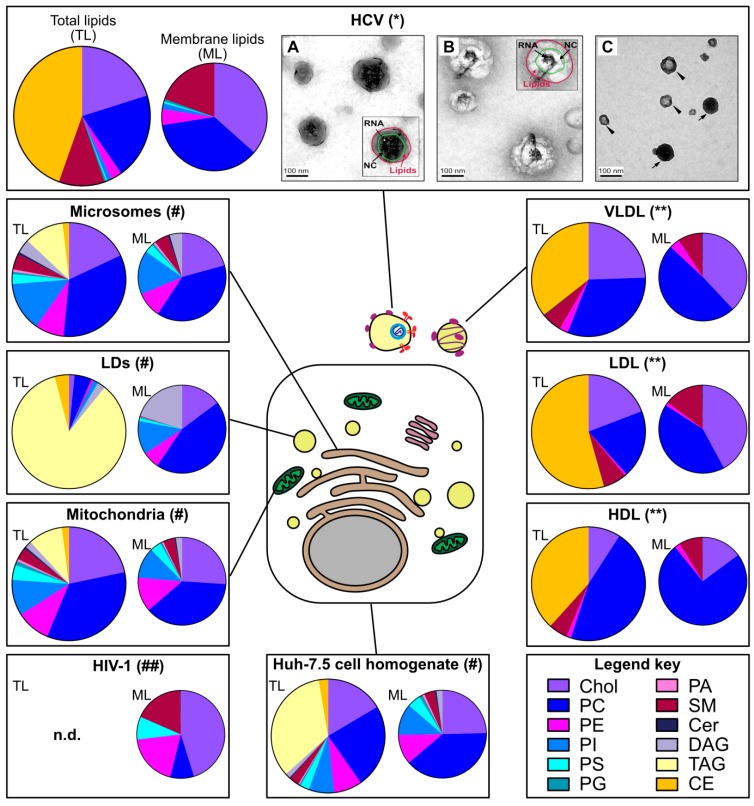
Hepatitis C virus (HCV) atypical lipid profile and morphology mimic serum lipoproteins. Within the top panel, (A) and (B) are electron micrographs of HCV grown in cultured cell lines (HCVcc) (A) and human serum-derived HCV (B) captured on electron microscopy grids with anti-E2 antibodies. Picture (C) was obtained by immunocapturing particles from the culture supernatant of HCVcc-producing cells with anti-ApoE antibodies. Arrows point at putative HCV lipo-viro-particles while arrowheads indicate presumed lipoprotein particles. Pictures (A), (B) and (C) were kindly provided by J.-C. Meunier, Université de Tours, France (unpublished material related to Piver E. et al. [17]).The different panels of the figure represent the lipid composition of different Huh-7.5 subcellular fractions (#) [21], as well as affinity purified Flag-tagged HCVcc (*) [15], velocity gradient purified HIV-1 virions (##) [34], and serum lipoproteins (**) [35]. In each panel, the left bigger pie chart represents all detected lipid species (total lipids = TL), whereas the right smaller chart focuses on the subset of membrane lipids (membrane lipids = ML). The comparison of the lipidomes of HCV and the microsomes, the latter comprising the ER which is the putative budding site of HCV, indicates a dramatic enrichment of neutral lipids in HCV particles (depicted in yellow), even though the TAGs could not be quantified for HCV in the source publication [15]. The individual membrane lipids also deviate from the host cell membranes. In contrast, the HCV lipidome resembles rather the ones of LDL and VLDL (right panels). Note that also different experimental conditions used in the four cited original studies might in part account for the detection of different lipid species. For example, triacylglycerides (TAGs) were not quantified in the HCV [15] and lipoprotein [35] lipidomes, and the HIV-1 proteome focused on membrane lipids [34] (hence the omission of the left pie chart). Therefore, we refer the interested reader to the original articles in order to find the details of the quantified lipids. Chol, cholesterol; PC, phosphatidylcholine; PE, phosphatidylethanolamine; PI, phosphatidylinositol; PS, phosphatidylserine; PG, phosphatidylglycerol; PA, phosphatidic acid; SM, sphingomyelin; Cer, ceramides; DAG, diglycerides; TAG, triglycerides; CE, cholesterol ester. The lipid species are displayed clockwise in the pie chart according to their order in the legend key.

