Figure 3.
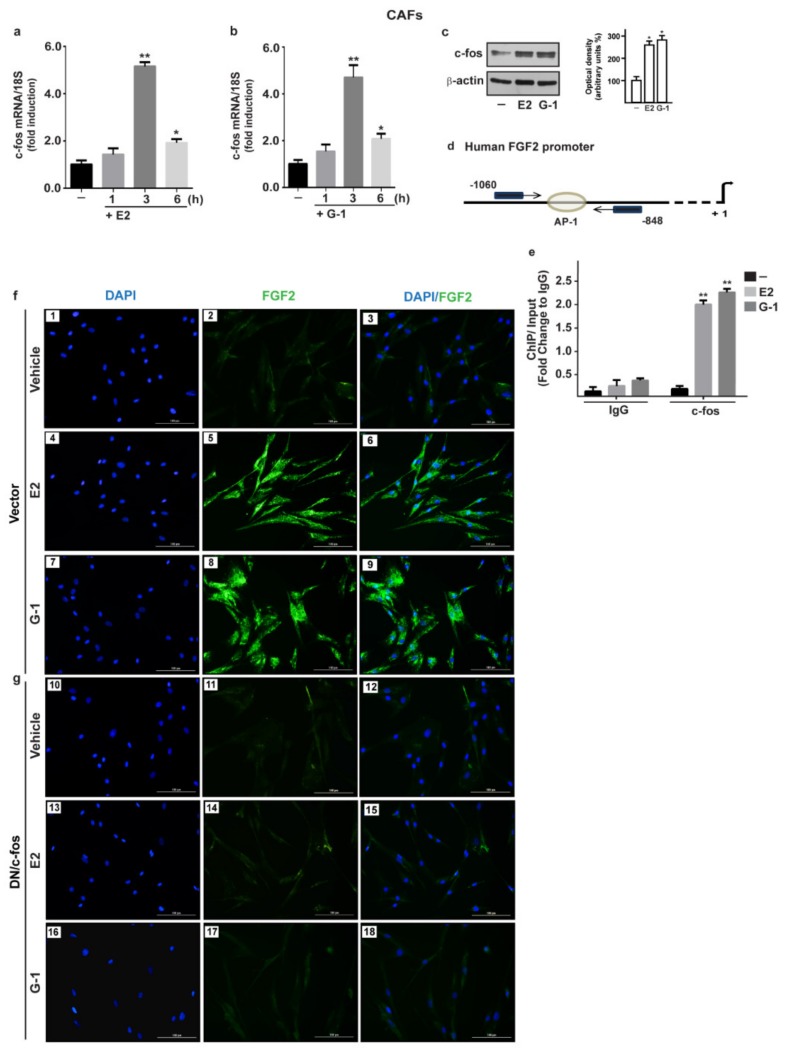
The oncogene fos (c-fos) is involved in the up-regulation of FGF2 by E2 and G-1 in CAFs. 10 nM E2 (a) and 100 nM G-1 (b) induced c-fos mRNA expression, as evaluated by qPCR. Values were normalized to 18S expression and shown as fold changes of c-fos mRNA expression upon E2 and G-1 treatments respect to cells exposed to vehicle (-). (c) The treatment for 3 h with 10 nM E2 and 100 nM G-1 up-regulated c-fos protein, which is recruited to the AP-1 site located within the FGF2 promoter region (-1060/-848; the transcriptional start site is indicated as + 1), as ascertained by Chromatin Immunoprecipitation (ChIP)-qPCR assay (d,e). Data were normalized to the input and reported as fold changes respect to Immunoblobulin G (IgG). Each column represents the mean ±SD of three independent experiments performed in triplicate. In immunoblot experiments β-actin served as a loading control, side panels show densitometric analysis of the blot normalized to the loading control. (*) indicates p < 0.05 and (**) indicates p < 0.01. (f) FGF2 protein expression by immunofluorescence in CAFs transfected for 18 h with a vector (panels 1–9), or (g) with a construct encoding for a dominant negative form of c-fos (DN/c-fos) (panels 10–18) and then treated for 6 h with vehicle, 10 nM E2 and 100 nM G-1, as indicated. FGF2 accumulation is evidenced by the green signal, nuclei are stained by DAPI (blue signal), scale bar = 100 μm. Images shown are representative of two independent experiments.

