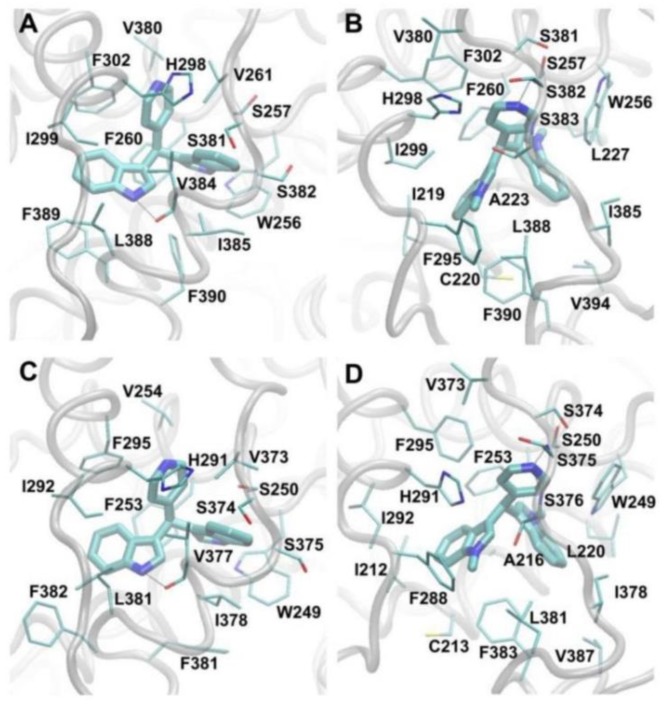
Figure 9.
Molecular graphic images of (A,C) C-DIM-Pyr4 and (B,D) C-1,1-CH3-DIM-Pyr4 in complex with (A,B) COUP-TFI and (C,D) COUP-TFII. The compounds are shown in licorice representation. Interacting COUP-TFI/2 residues are shown in thin licorice representation, and COUP-TFI/2 backbone atoms are shown in transparent, gray tube representation. Hydrogen bonds are indicated using black, dotted lines.

