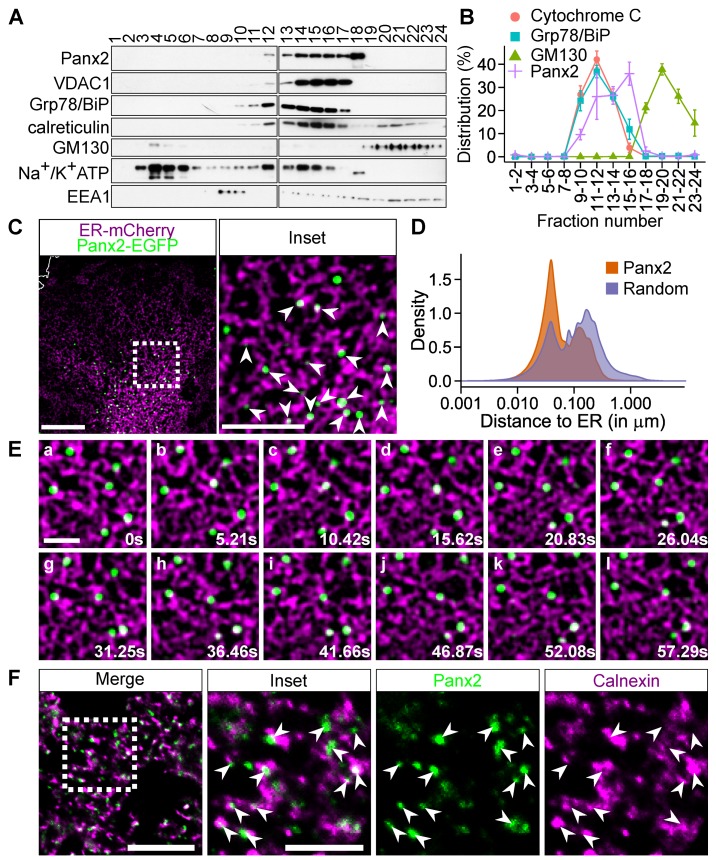
Figure 1.
Pannexin 2 (Panx2) clusters in endoplasmic reticulum (ER) microdomains. (A) Panx2 co-fractions with ER and mitochondrial markers. Post-nuclear supernatant from C6 Panx2-enhanced green fluorescent protein (EGFP) cells was fractionated by ultracentrifugation and twenty-four fractions were collected and immunoprobed for various organelle markers. A substantial amount of Panx2 co-fractionated with mitochondrial (voltage dependent anion channel 1 (VDAC1) and ER (Grp78/BiP, calreticulin) markers. (B) Three additional fractionations were performed but fractions were paired to allow the probing of all fractions on a single membrane for quantification. Panx2 distribution positively correlated (Pearson’s correlation) with the mitochondrial marker cytochrome C (r = 0.633, p = 0.0273) and the ER protein Grp78/BiP (r = 0.76, p = 0.0041) but not with the Golgi marker GM130 (r = −0.407, p = 0.1892). (C) C6 Panx2-EGFP cells were transfected with an ER-targeted mCherry construct and trajectories of Panx2 puncta were tracked in living cells. A large majority of Panx2 puncta were located on the ER network as indicated by the white arrowheads (inset). Scale bars: 10 µm and 5 µm (inset). (D) The probability distribution of Panx2 puncta (orange curve) was compared to the probability distribution calculated after randomizing the trajectories of Panx2 puncta within the cytoplasm (purple curve). The distributions, calculated from 13 cells, show that a larger proportion of Panx2 puncta was localized on the ER network prior to randomization. (E) Frame sequence showing that Panx2-ER association was stable for over 55 s despite the high mobility of the ER network during that period. Scale bar, 2 µm. (F) Mouse brain sections were stained for Panx2 and the ER marker calnexin. Panx2 formed discrete puncta that primarily clustered in ER microdomains as indicated by the white arrowheads (inset). Scale bars, 10 µm (inset 5 µm).

