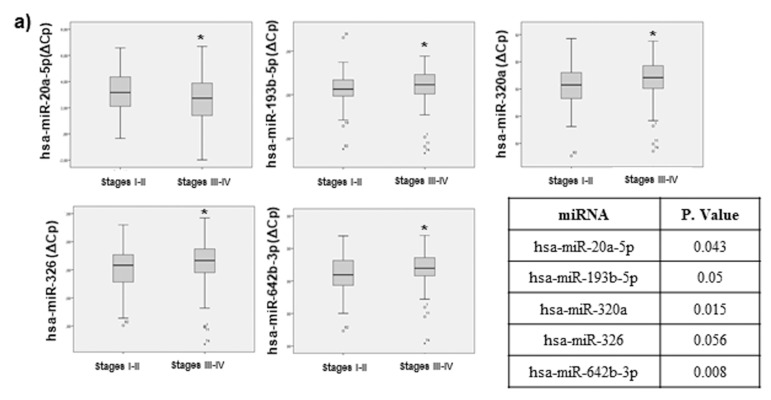
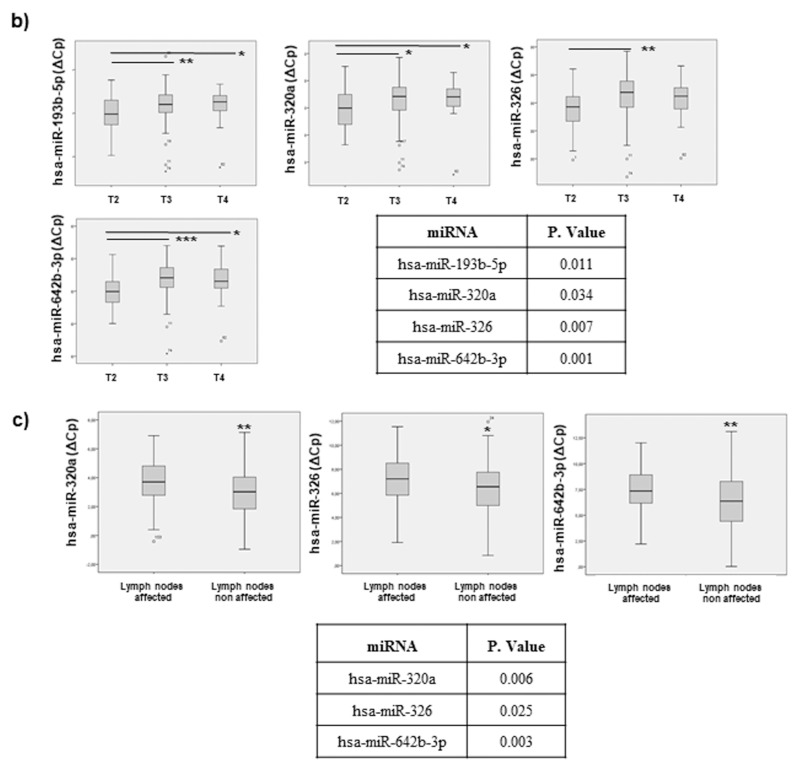
Figure 4.
Statistical correlation between selected miRNAs and TNM stage (tumour-node-metastasis TNM staging system), tumour invasion and progression. Statistical analysis using SPSS 19.0 between miRNA levels expressed as DCT was performed. Only miRNAs exhibiting statistically significant correlations are shown. Data are presented as median and interquartile range with p values < 0.05. (a) data regarding correlation with tumour stage (b) tumour invasiveness and (c) lymph node affection are presented. * p < 0.05, ** p < 0.01, *** p < 0.001.


