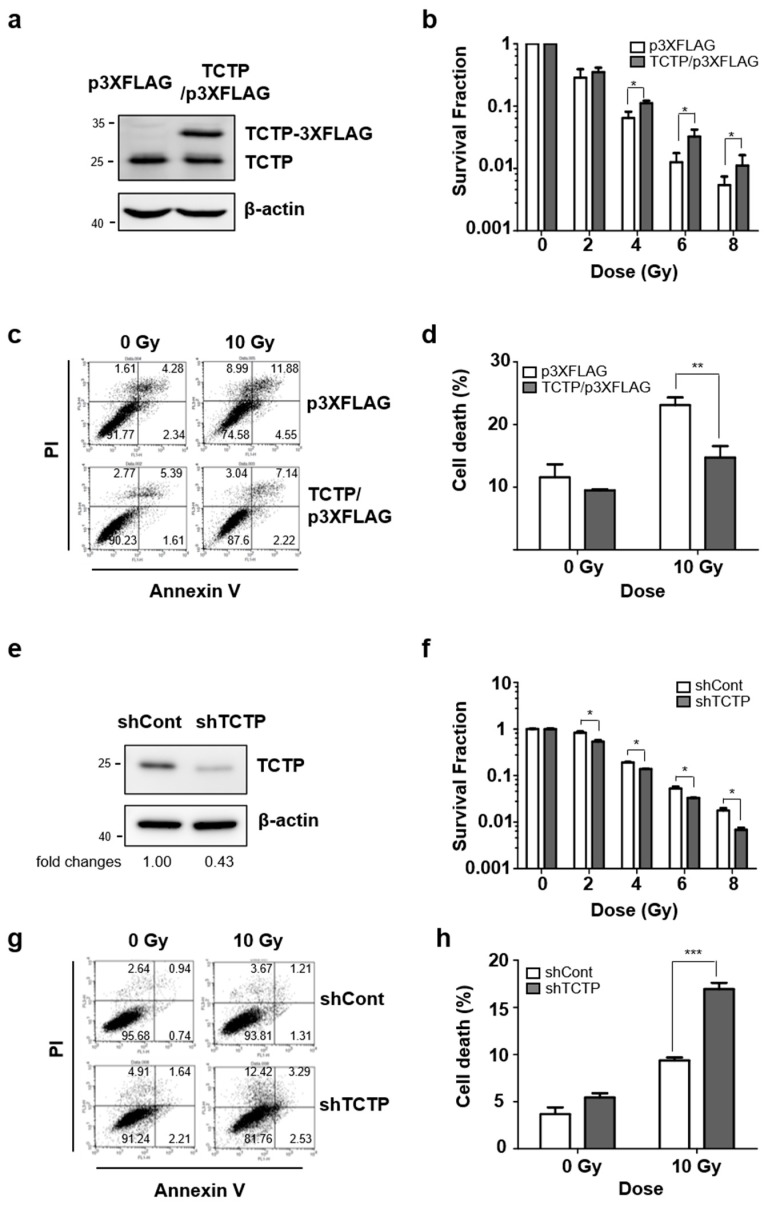
Figure 3.
TCTP involves in radioresistance in cancer cells. (a) MCF7 cells were overexpressed with TCTP-3Xflag and overexpression of TCTP-3Xflag was confirmed using Western blot analysis. (b) TCTP-3Xflag-overexpressed MCF7 cells were treated with different doses of γ-radiation and the survival fraction was measured by clonogenic formation assay (n = 3). Cells were treated with γ-radiation of 10 Gy and dead cell populations were determined after 48 h. (c) The representative images of PI-Annexin V double staining examined in TCTP-overexpressed MCF7 cells and (d) the graph of apoptotic cells is shown (n = 3). (e) A549 cells were transfected with TCTP shRNA (shTCTP) and control shRNA (shCont) and TCTP down-regulation was confirmed using Western blot analysis. (f) TCTP-knockdown A549 cells were treated with different doses of γ-radiation and the survival fraction was measured using clonogenic formation assay (n = 6). Cells were treated with γ-radiation of 10 Gy and cell death was analyzed using flow cytometry (n = 3). (g) The representative image of PI-Annexin V double staining examined in TCTP-knockdown A549 cells and (h) the graph of the dead cell population is shown. The cropped blots are used in the figure, and full-length blots are presented in Figure S7. Bars represent the means ± SEM. * p < 0.05, ** p < 0.01, *** p < 0.001 by two-way analysis of variance.

